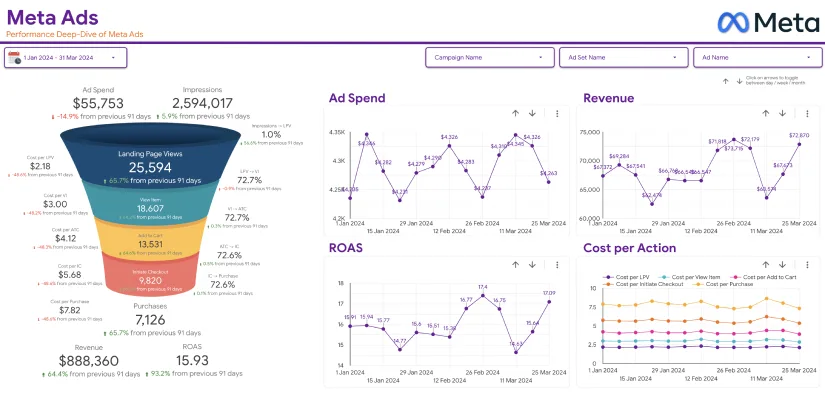
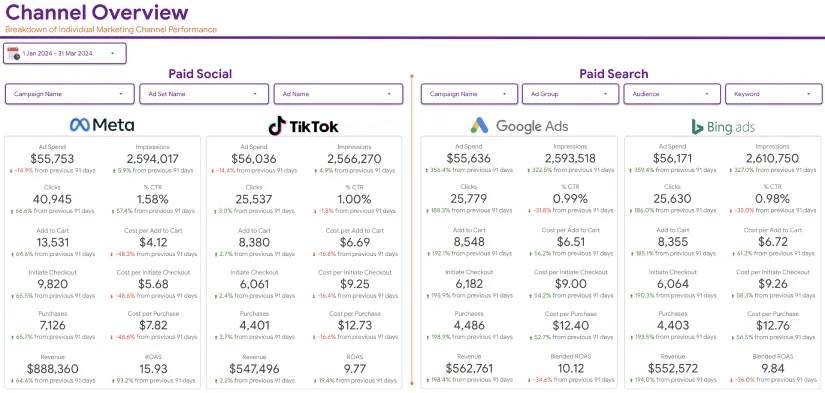
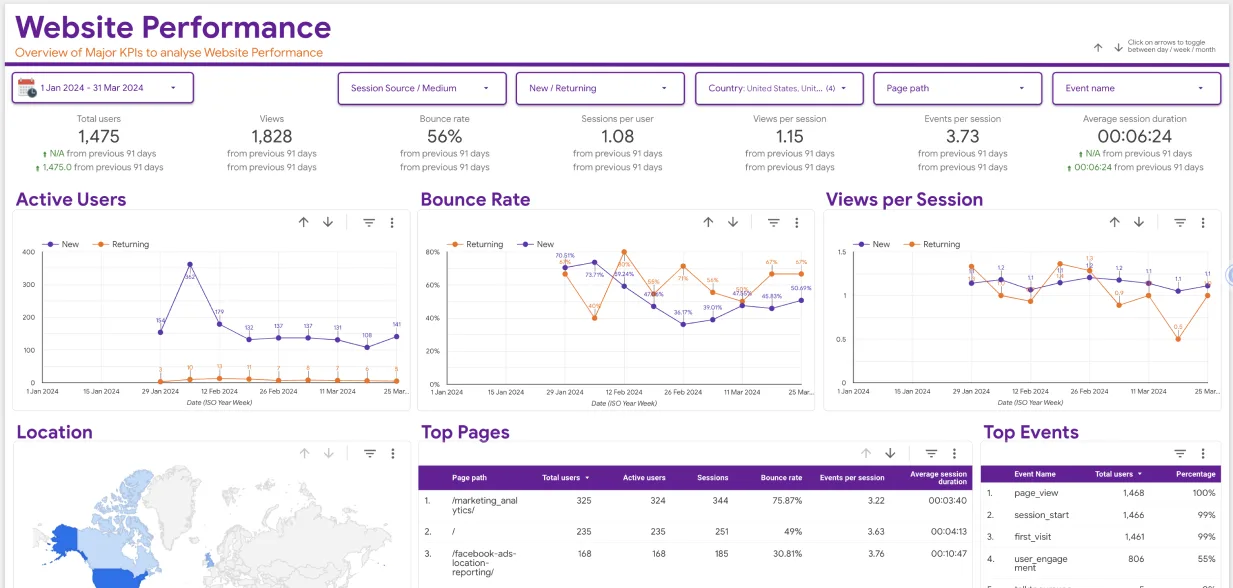
The Google Data Studio keyword ranking dashboard is an indispensable tool and a best friend to any marketer serious about their SEO and digital performance. Keyword performance tracking is a tough nut to crack, especially if you’re still scrambling between browser tabs and spreadsheets. However, with a dedicated dashboard that keeps everything tidy and visual, it can surely be a walk in the park for you.
A data studio keyword rank tracker dashboard offers real-time data feeding into charts that won’t just keep you informed—they’ll impress you in every aspect. When you need to demonstrate to clients or executives why they should invest in SEO, this dashboard comes in handy. Google Data Studio removes all the difficulties in setting up the keyword tracking dashboard, giving you a one-stop shop for the data analytics you could ever need.
So, if you haven’t thought about building a serious keyword ranking dashboard with Google Data Studio, here’s your chance to do so. In this guide, we’ll walk you through setting the dashboard up, step by step, without breaking a sweat.
What Is Google Data Studio?
Google Data Studio, now Looker Studio, is a web-based reporting tool that transforms raw data into sleek, interactive dashboards and reports for SEO marketing campaigns. It’s one of the most essential tools available for free that every marketer should leverage for campaign success. Think of Google Data Studio as your data whisperer, retrieving data from multiple sources like Google Search Console, Google Analytics, and other third-party apps. It works on the data to turn them into visually striking graphs, tables, and charts.
It offers real-time updates, which means you’ll always have the freshest insights at your fingerprints. But what makes it even better is that it’s collaborative, meaning multiple users can access and tweak the dashboards simultaneously. This makes it ideal for teams that work on the same page.
Steps for Setting Up Google Data Studio Keyword Ranking Dashboard
Enough of the chitchat, now let’s get started with the process of building a keyword ranking dashboard in Google Data Studio. Here are the steps to follow to help you visualize your keyword rankings through a powerful dashboard.
Step 1: Set Clear Objectives

What’s your reason for building a keyword ranking dashboard? Are you interested in monitoring your organic traffic growth? Do you want to see keyword position shifts? Go ahead and establish the KPIs that matter to your campaign, whether it’s impressions, average rank, clicks, or SERP features.
By setting clear objectives, it’s easier to filter out the fluff so you can focus on the performance metrics that drive real action.
Step 2: Gather Your Data Sources
Google Data Studio works its magic by pulling in data from sources like Google Search Console, Google Analytics, and even third-party SEO tools (if they’re compatible). Make sure all the accounts are connected to your Google Data Studio account.
If you’re primarily tracking search performance, Google Search Console Data Studio should be your first stop. Follow these steps to integrate the Search Console:
- In your Google Data Studio account, click the “Data Sources” tab at the top section of the page.
- Click the “Create new data source” button, fill in the form with your basic information, then click continue.
- Click the “Yes to all” button to add all the preferences to your new data source setup.
- Close the popup and scroll the list of data sources until you find the Search Console.
- Click the “AUTHORIZE” button and follow the wizard to complete the integration.
- Choose the relevant property (your website) and pick the site metrics you need, such as impressions, click-through rates (CTR), and positions.
If you want a more robust view, connect other sources from third-party apps like Ahrefs or SEMrush. Pulling data from multiple sources allows you to do comparisons on keyword rankings, SERP features, and organic traffic, all under one roof.
Step 3: Map Out Your Dashboard Design
This is where your creativity comes into play. Think about the structure of the dashboard, and also consider adding multiple pages and sections. Some of the essential features in a typical Google Data Studio keyword ranking dashboard can include:

- Overview page: Include the top 10 performing keywords, organic impressions, and CTR trends.
- Position tracking: You’d want to know the changes in your keyword positions with time, so also include rank-up or rank-down indicators.
- Traffic breakdown: This should include the keywords that are driving the most traffic to your website.
- Region and device performance: Include metrics to let you know how keywords are performing across desktop and mobile devices and according to location.
Don’t forget to leverage charts to highlight trends at a glance. For instance, if you want to track keyword position shifts over a period, use a line graph. On the other hand, tables are ideal for displaying specific keywords ranked by performance metrics.
Step 4: Add Filters and Controls
Filters and controls are essential to have if you want your keyword ranking dashboard to be interactive. They allow users to view data by data, keyword group, or location. For instance, a “Branded vs. Non-branded keywords” filter offers a detailed view of the performance of each group.
An important tip that you’ll find very useful is to include date range controls to allow you to shift quickly between periods (e.g. last 30 days). This can help you identify the emerging trends in the market before your competitor does.
Step 5: Create Keyword Position Charts
An important part of your SEO keyword tracking dashboard is a chart that shows the position of different keywords you’re keeping track of. Here’s how to build a chart to keep track of keyword ranking performance:
- Add a table chart and connect it to the Search Console data.
- Use “Query” as your dimension—this represents keywords.
- Under metrics, select Impressions, CTR, and Average Position.
- Apply conditional formatting to highlight keyword position changes. For example, green for improvements and red for declines.
Next to each keyword row, add a sparkline graph for visualizing trends without overwhelming the raw data table.
Step 6: Incorporate Google Analytics for Traffic Insights

By now, your keyword ranking dashboard should work. But tracking keyword positions alone isn’t enough; you have to also know how those rankings affect your website traffic. That’s where Google Analytics chips in—use GA data to monitor page views and sessions from organic search.
Ensure you’ve connected both Google Analytics and Search Console to your keyword ranking dashboard. This will allow you to cross-reference how changes to keywords affect site traffic. For instance, if a web page changes from position 7 to 3, are you witnessing a corresponding improvement in organic traffic? If that’s not the case, then it’s likely your titles or meta descriptions are poor. This could lead to low CTR despite higher rankings.
Step 7: Add Insights and Annotations
What’s the value of data if your audience can’t interpret it? Make it easy for your clients and stakeholders to interpret your dashboards by adding text boxes to important areas of your dashboard for insights.
For example, “Top keywords for Q4 are driving 25% more traffic compared to Q3 (Google Search Console).” With such insights, stakeholders and clients can grasp what’s going on without over-analyzing the charts.
Step 8: Automate Your Reporting
Manual reporting is such a hassle that nobody likes it, so why not automate it? Google Data Studio offers scheduled email reports that you can use to automatically send your keyword ranking dashboard to clients or stakeholders. You can also set the frequency to daily, weekly, or even monthly.
This feature plays an important part in keeping everyone in the loop without you having to lift a finger.
Step 9: Test, Refine, and Tweak
Your Google Data Studio keyword ranking dashboard won’t be perfect, and that’s nothing to worry about. Once it goes live, request feedback from your clients or stakeholders. Maintain flexibility and make changes to the layout as required. Remember, SEO is a moving target, so your dashboard needs to evolve with it.
Bonus Tip: SEO Trends to Watch

Google search engine runs core updates (changes to algorithms and systems) several times a year. So, expect keyword performance to fluctuate always. Search intent shifts and mobile-first indexing are driving new keyword ranking trends. Ensure you stay up to date with these developments and tweak your dashboard accordingly to stay ahead of the curve.
Why Implement Google Data Studio Keyword Ranking Dashboards in SEO Campaigns?
One of the biggest challenges of SEO professionals is managing huge chunks of data from more than one source. Doing manual collection and analysis of data from sources like SEMrush, Ahrefs, Google Analytics, and Google Search Console is not only time-consuming but also tedious. Google Data Studio offers numerous benefits that can simplify your work when trying to determine your SEO keyword rankings:
Integrate multiple data sources
Google Data Studio has proven reliable and effective for its power to integrate several data sources, auto-generate reports, and build visually attractive dashboards. You won’t stress yourself with searching for data on different platforms, but instead, you’ll have your Google Data Studio keyword ranking in an easily accessible interface.
Actionable Insights
Other than saving you time and hassle, Google Data Studio offers actionable insights through visualizations that are easier to understand. These data visuals simplify complex data into compelling stories that tell how your SEO campaign is performing when creating keyword ranking reports for stakeholders and clients.
Easy-to-Understand Visual Charts
Don’t stress decision-makers with huge chunks of data that’ll require a lot of effort to digest. Instead, use SEO dashboards in Google Data Studio to provide detailed informational graphics and charts to present your SEO performance data.
Wrapping Up
Google Data Studio keyword ranking dashboard is more than just a fancy tool—it’s the key to mastering your campaign’s SEO. It integrates multiple data sources into one and offers interactive views that highlight what is working and what is not. With a well-structured dashboard in your campaign, it’s easier to monitor keyword performance, adapt faster to changes, and impress your stakeholders and clients with real-time reports. And let’s be honest, who doesn’t love a dashboard that makes you look like a wizard with data?
Make use of this guide to build yourself a data studio keyword rank tracker that actually works. If it’s all difficult to put together, let data analytics experts at Eaglytics Co. help you build a powerful Google Data Studio Keyword ranking dashboard that meets your specific SEO needs. Go ahead and reach out to Eaglytics Co. today to kickstart your journey to SEO growth.


