When it comes to marketing on the internet, as well as web analytics, user behavior plays a crucial role in improving the performance of your website. Bounce rate is one of the most frequently analyzed metrics by analysts. Nevertheless, as users slowly adjust to Google Analytics Version 4 from its predecessor Universal Analytics, many of them wonder: how to see bounce rate in GA4?
This article will explain the notion of a bounce rate, how GA4 quantifies user engagement differently, and how will we be able to access and understand this very useful metric.
Bounce rate
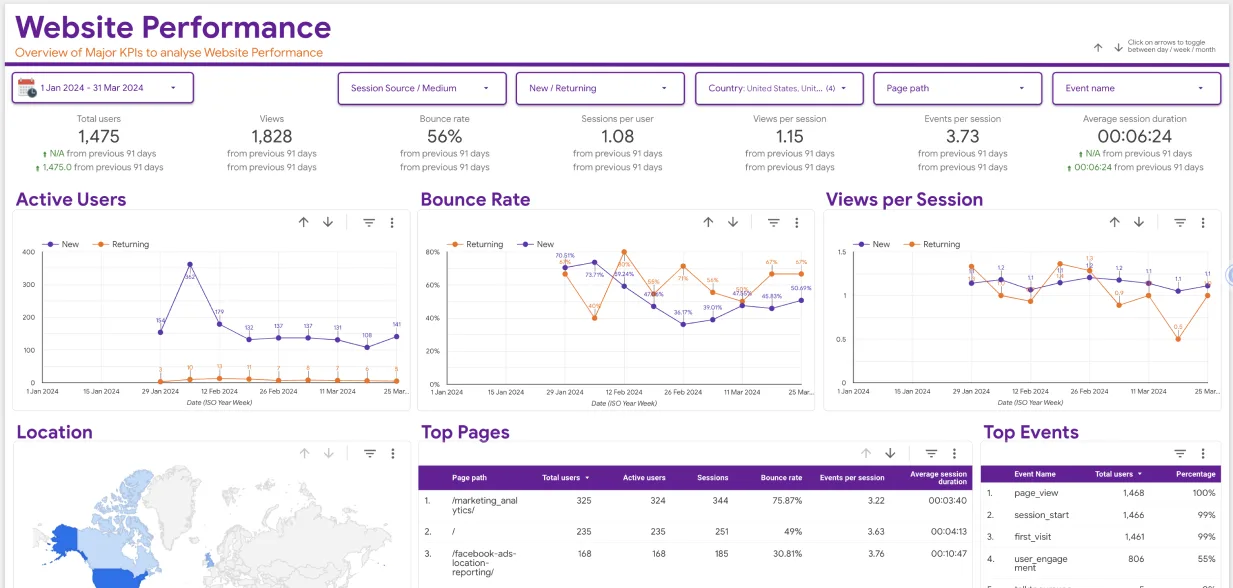
As the term itself suggests, has quite a literal meaning. It is the number of visitors who come to the website, view a single page, and immediately leave without visiting any other page expressed as a percentage of the total number of visitors. A high bounce rate is generally taken to mean that the visitors cannot find what they are looking for or that the first page they encounter is not interesting enough.
Standard Definition of Bounce Rate vs. Engagement Rate
When it comes to Universal Analytics, defining bounce rate is as easy as it can ever get:
Nevertheless, in GA4, the notion of bounced sessions is barely touched as it is all about the engagement. In striking contrast to Tradition where only single page visits are considered, in GA4, the engagement rate is introduced. Engagement rate is the ratio of all the engaged sessions to the total number of sessions within a given period. An engaged session is deemed to be a session that consists of at least one of the following:
- The session is greater than 10 seconds.
- A conversion event occurs in the session.
- More than two pages are viewed during the session.
Hence, the bounce rate in GA4 can also be represented simply as
Bounce Rate =100 −Engagement Rate
This new approach demonstrates that simply counting the number of pages dived into is no longer the case, it is the engagement levels that matter.
Why is Bounce Rate Important?

Now you know what is bounce rate, you need to know why it is important. It is important to know the bounce rate for different reasons:
- User Engagement: Most likely, a high bounce rate may mean that the viewer did not find the content of his/her interests or the environment is not encouraging.
- Content Optimization: Whenever people are making a strategy on how to improve or amend the site, an appropriate and thorough analysis of bounce rates should come into play.
- Conversion Tracking: Such figures as high bounce rate usually connect to low conversion rates. Knowing this metric is critical for determining how to make effective pathways for conversion.
- SEO Insights: Search engines only use bounce rate as one of the engaging quality metrics. It means that a high bounce rate will be harmful to SEO.
- User Experience Feedback: Bounce rate provides data regarding the way users interact with the site. For example, when users tend to spend very little time on the site, this may be an indication that insufficient effort was made to ensure the content contained within the page corresponds to the expectations of the users and its layout is not baffling.
How to track Bounce Rate in GA4?
Here are some simple steps you can follow to assess your bounce rate in GA4.
Step 1: Accessing Your GA4 Account
Go to Google Analytics and choose a property you wish to analyze.
Step 2: Sessions & Events Report
Click on Reports, in the left side menu: This is the section Pedro would like to focus on.
Engagements report: In the “Engagement” section, there are further reports: “Pages and screens”, “Events” and “Conversions” among others.
Step 3: Clicking on Pages and Screens
Next, select: “Pages and screens”: This report highlights how specific pages perform.
Engagement Rate Metric: There is an “Engagement Rate” metric available in this report which is a key metric in the computation of the bounce rate.
Step 4: Personalize Your Interface. Clip Adjust Date Range. The date range also is available for modification through the top right corner of the analysis.
Include Metrics: In the advent that the engagement rate is hidden, the table can be modified from the report view by clicking on the ‘Customize report’ option. From there, the engagement rate metric can be included in the report view.
Step 5: Define Bounce Rate
Because GA4 does not provide bounce rate as a key metric, it can be computed using engagement rate as follows:
Bounce Rate = 100 – Engagement Rate

Reading and Understanding the Bounce Rate Data
After gaining the rate of engagement and determining the bounce rate, the next step is to ensure this data is properly interpreted.
Analyzing the Bounce Rate Trends
- Low Bounce Rate (0-40%): This is usually considered to mean that users can navigate through the content and find what they are looking for. It can also indicate that marketing has been done well in directing users to the appropriate pages.
- Moderate Bounce Rate (41-70%): It may offer some optimism. It could suggest that users engage to a degree, but do not click to any further pages.
- High Bounce Rate (71% and above): This normally raises the alarm. It is common to assume that the visitors will be disinterested in the content or that it does not meet their purpose. If this happens, further explorations are very important.
Breakdown of Bounce Rate
To extract maximum information segment your bounce rate data:
- By Traffic Source: Pay attention to the bounce rates from different traffic sources such as organic, paid, social media traffic, etc. to see which sources bring engaged users.
- By Device Type: Analyze how bounces differ for desktop, laptop, mobile, and tablet users. This helps to design and optimize cross-device users better.
- By User Demographics: Understand how bounce rates differ across user demographics to better content and marketing strategies for different audience segments.
- By Landing Page: Study which landing pages have a high or low bounce rate across the website to know which pages are effective and which pages will require improvement.
Stride towards a Lower Bounce Rate
If your bounce rate reaches higher than expected levels, then the following strategies ought to be put into action:
Enhance the Quality of the Content

Relevance: Make sure that the content you provide is relevant and appropriate to its intended audience. For instance, trends and topics can be found with the help of Google Trends.
Clarity: Make use of engaging titles and subtitles to structure content that the reader may find difficult to read in one go. Use bullet points and lists for an easier understanding of textual information.
Visuals: Use pictures, videos, and graphics within the content to increase the audience’s interaction with the content. This is because visual content tends to extend the period in which the audience spends on the page.
Speeding Up the Website
Many factors contribute to high bounce rates, such as slow-loading pages. Tools such as Google Page Speed Insights can be used to assess, analyze, and improve loading times. Endeavor to have a loading time of less than three seconds.
User Experience Improvement
Navigation: Maintain an effective navigation on your website by providing clear entry and exit points to all other pages. Users will be interested and engaged within the website by having structured menus.
Responsive Design: It is important to address the mobile users because they play a big role in the site’s bounce rate. Mobi and jqtouch are good tools for responsive design which tend to enhance usability.
Employ Effective CTA
Urge users to perform certain actions within your site. Well-framed CTAs can lead the users to more pages thereby decreasing the bounce rates. Use verbs to communicate a call to action and design the posters well.
A/B Testing
A/B tests any aspects of your pages that visitors see (headlines, images, CTA, etc.) to know which version is better while keeping the visitors. Record the metrics of the regions using gaze attribution in GA4.
Capture User Attention Without Delay
Devising ways to keep users busy as soon as they arrive at the page is essential. This could be in the form of pop-ups, videos, sound elements, or any other feature that draws one’s attention.
Resolve Technical Issues

Always, there may be some ‘technical’ factors that exacerbate user behavior such as dead ends through broken links or error pages. Take these precautions technically by checking your site regularly for any errors and fixing them.
Advanced Bounce Rate Management and Tracking: An Ulterior Perspective
Explore Events and Conversion
In GA4 it is possible to set up certain events that go along with your business objectives. For instance, the ability to track video completion, the submission of specific buttons, or even the filling of certain forms gives a more comprehensive view of user engagement besides page views. The primary goal is to make every page visitor interact with the content in one form or another. This data can then help in adjusting the marketing strategy that targets home page visitors and the bounce rates of other pages.
Generate Custom Segments
Users should be grouped into custom audiences according to their behavior. For example, there can be segments for the users who visited the site and did some action but made no conversion. Such audiences can be studied to find out what dissuades them from converting.
User Path Analysis
The User Explorer section of GA4 enables you to study how users navigate the website at hand i.e. the interaction with web pages. How users look through your pages usually which pages they glance into and which they do not helps you know the point at which they lose focus and leave.
Migrate to Enhanced E-commerce Tracking
GA4’s enhanced e-commerce tracking is invaluable in understanding user behavior as they go through the shopping process, especially on e-commerce websites. Knowing user behavior towards product pages can inform how those pages are optimized to lower the vertical traffic on them.
Analytics- Behavior Cohorts
Take advantage of the cohort analysis feature found in GA4 to manage users by behavior over time. This is especially useful in recognizing trends and assessing the effect of any adjustments on the site on user activity as well as user drop rate.
Building Reports and Dashboards regularly

Make routine reporting and dashboards in GA4 so that bounce rate and engagement metrics will be kept at the minimum. Bring targets for performance and their progress within time.
Final Thoughts
As organizations make the switch from Universal Analytics to Google Analytics 4, a change in the definition and measurement of the bounce rate has taken place. From counting pages viewed, UX has taken the center of focus, especially with information content usage. Bounce rate does not feature directly in GA4 as a basic metric even though a user can find out the bounce rate with engagement rate with ease.
Most of the digital analysis trends have expanded from simply counting the number of content pages accessed by a user to gauging the user interactions with the content over some time.
By using the engagement metrics in GA4, a business can interpret the information on its users’ behavior, and therefore improve the business’s websites. Proper assessment and appropriate changes lead to lowering bounce rates and improving the user’s satisfaction thereby increasing the chances of conversion.
This exploration of bounce rate within the context of GA4 goes beyond analytics as the measurement of a single numeric value about user activity on a site. This metric shows how users behave on the site and enables monitoring and devising of alternative options aimed at improving the attractiveness of a site to users. If you are a digital marketer or running a small business, engaging users remains the biggest challenge in this era.
Now that you have appreciated how to look at bounce rates on GA4 and evaluated how to employ the addresses and further images in Cook, etc. then too will the images will help you further artistic or otherwise success.


