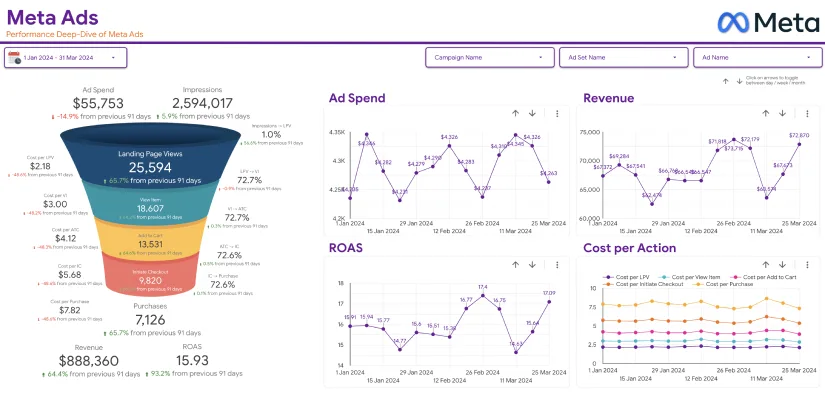
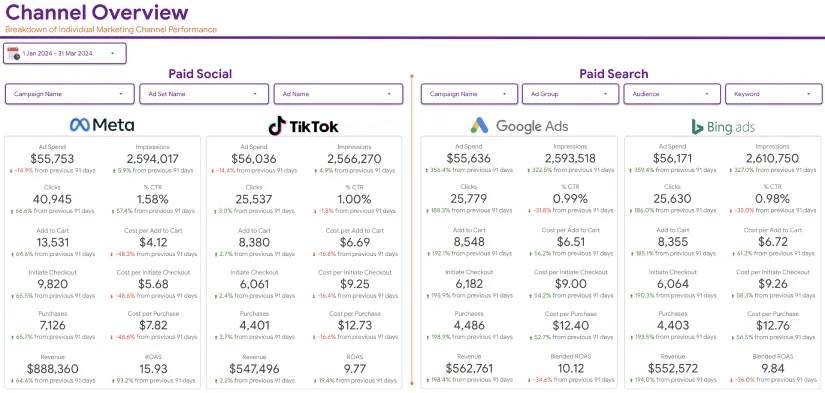
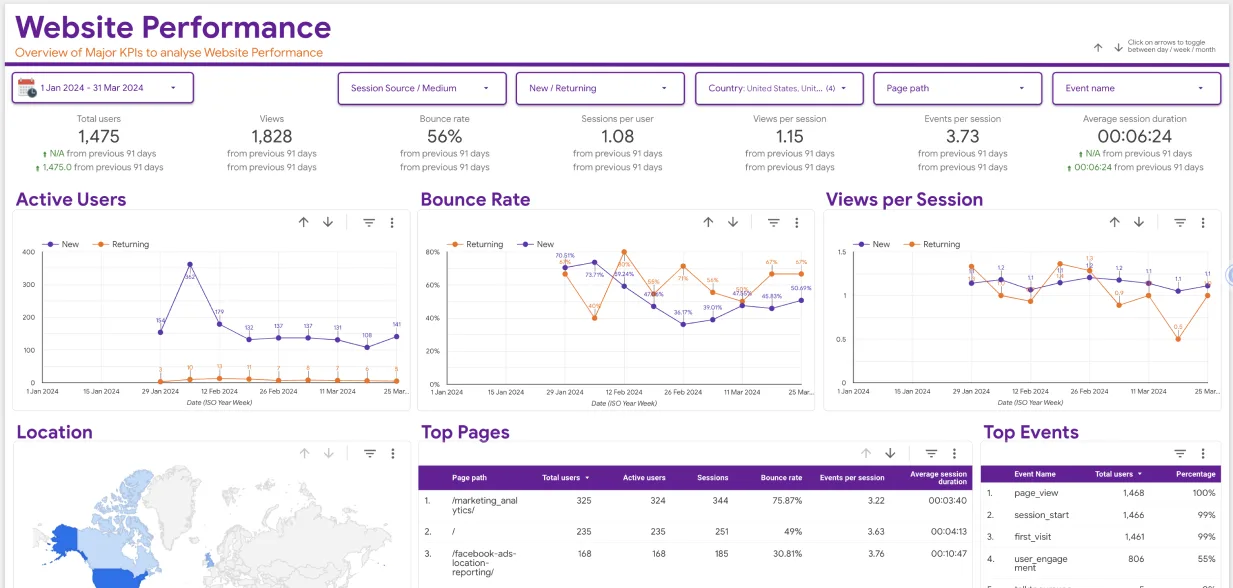
Various types of dashboards help organizations and individuals display technical data in their simplest format. These technology-driven data visualization tools provide crucial insights in a manner that any viewer can understand. Besides, dashboards enable data analysts to deal with the challenge of handling the ever-increasing data quantities, sources, and types.
If you are still using spreadsheets to organize and display your data, you are missing out a lot. Create a data visualization dashboard instead and you will see a significant difference. You can make many dashboard types, as you will discover below.
Types of Dashboards Enabling Excellent Data Visualization
Your business has unique needs and may not use all types of dashboards for data visualization. Thus, try to understand each dashboard type before determining the ones that suit your needs best.
So, what are the types of dashboards you can add to your business for easier data visualization? Here are 15 types of dashboards to focus on:
If you follow sales you have made on Facebook ads, you can eventually boost your ROI. Assuming you do not know the process, here is a detailed guide. It explains how to track purchases on Facebook ads in two ways.
1. Strategic
A strategic dashboard enables the top management to measure the company’s performance against its long-term objectives. It aids systematic goal-setting and decision-making processes by tracking high-level key performance indicators.
Strategic dashboards demonstrate the company’s ability to attain its long-term objectives and display the progress it is making. Since they display the higher-level view of an organization, strategic dashboards contain varied types of data. Some of these include:
2. KPIs
The main types of dashboards also entail key performance indicators (KPIs). An organization should start by picking the most important metrics for measuring progress toward the achievement of short-term and long-term goals.
KPI dashboards enable managers to check performance and spot areas that might require improvement. Each KPI focuses on tracking how fast or slowly a company is moving towards a given objective. It may display the following metrics:

- Productivity
- Worker performance
- Sales and profit figures
- Customer service and satisfaction levels
- Inventory levels.
- Marketing
3. Marketing
You can make different types of dashboards for your sales and marketing team. The chief role of these is to track the progression towards achieving certain marketing key performance indicators. Depending on the business you run, these KPIs can include these metrics:
- Customer conversion rates
- Cost for every lead
- Traffic towards a website
- Customer retention rate
- Cost of acquiring a new customer
4. Operational
Analytical dashboards are crucial tools for data analysis. These dashboards enable BI (business intelligence) experts and data analysts to probe a certain data set to discover unique trends, insights, and patterns in it.
These tools facilitate thorough data examination and expert decision-making. An analytical dashboard may entail metrics such as:
They use it to make urgent decisions and resolve workflow issues before they escalate. Unlike a strategic dashboard, an operational one checks the progression towards the attainment of short-term goals and daily operations.
They highlight operational KPIs that call for immediate attention. Hence, operational dashboards enable workers to maintain smooth workflows. Some of the vital metrics that operational dashboards track include:
- ROI
- Customer satisfaction rate
- Sales revenue
- Amount of new consumers
- Average order value.
5. Analytical
First, Meta Pixel is a code extract you can add to your e-commerce website or store to track purchases on Facebook Ads directly on your site. Configuring Meta Pixel settings begins on your Facebook account.
- Customer behavior trends
- Staff performance
- Sales figures by region
- Sales figures by product or service
- Stock levels
- Output efficiency.
6. Tactical
Another of the top types of dashboards is the tactical dashboard. Organizations use tactical dashboards to check the progress of projects or goals with short or moderately long deadlines. Ideal for department heads and mid-level managers, tactical dashboards focus on tracking operational efficiency to help an organization achieve its strategic goals.

It displays the progress various departments have made to ensure the organization attains its strategic visions and goals. Managers can then rectify activities that do not align with their organizational vision. A tactical dashboard in the sales department can help heads compare periodical results to their specific forecasts.
7. Sales
Sales types of dashboards are ideal for checking the performance of related key performance indicators. They help a sales team determine things like revenue, profit margin, win rate by team, win rate by individual, market penetration, sales cycle’s average length, etc.
Teams gather data for their sales KPIs from the customer relationship management software. A dependable sales dashboard will show pipeline data, allowing the team and managers to see how many deals are in every sales phase.
If some details are stuck, they can determine why and solve the problem. Also, sales dashboards can provide essential data for creating projections. They can show you exactly what to do to increase your sales revenue.
8. HRM
Human resources are an asset to every company. Without them no department can run smoothly. However, without professional management, human resources can often become less productive.
Some of the best tools for managing people in an organization are HR types of dashboards. These help personnel managers track certain HR key performance indicators. The data they obtain from these dashboards can help them enhance recruitment, performance appraisal, on-the-job training, employee motivation, employee retention, etc.
These types of dashboards often have metrics like:
- Employee turnover rate
- Best time to hire
- Employee retention rate
- Workers ‘satisfaction score
- The rate of absenteeism
- Employees’ engagement score
- Workers’ compensation review
- Training cost per worker
- Staff promotions.
9. Finance
Among the types of dashboards most organizations make include the finance dashboard. Like other dashboard types, this one measure specific KPIs related to the finance department.

The Chief Financial Officer or another head of the financial department often uses a finance dashboard to monitor the fiscal position of a business. They utilize data from this dashboard to create sensible financial projections and enhance operations within their department.
A financial dashboard will often track metrics like expenditures, gross profit, net profit, operating profit, sales revenue, accounts receivables and payables, cash flows, balance sheets, etc. They will extract any beneficial metric from the company’s general ledger book.
10. Executive
Executive types of dashboards serve the top management officials. Senior managers use them to gather high-level data that provides a clear picture of the organization’s overall performance. These types of dashboards support executive decision-making processes regarding profit margins, sales revenue, employee turnover rate, market share and so on.
11. Project
Project dashboards are common when an organization has a large project it is overseeing. This dashboard helps the company track its progress towards achieving various milestones for this project.
12. Performance
Among the most crucial types of dashboards is the performance dashboard. This data visualizer works where managers want to measure the performance of someone or something. Performance dashboards are indeed perfect for evaluating workers ‘performance.
You can then determine the best workers and reward them accordingly. Performance dashboards can also help leaders in the finance, marketing, sales and advertising, and inventory divisions.
13. Geographical
A geographical dashboard is a data visualization tool that illustrates data on a map. It may use various kinds of visualization methods, including polygons, points, and lines. Geographical dashboards require a location-based element to work.

For instance, you can use these types of dashboards to group sales data by region or view the distribution of assets by a given location. They help users discover trends and patterns that are harder to find when evaluating raw data.
14. Mobile
A mobile dashboard supports the remote working model. They help remote or field workers access organizational data while on the move. Based on the displayed data, these employees can make decisions or take actions that can help mitigate a problem. Mobile types of dashboards are available on mobile devices like tablets and smartphones.
15. Industry
An industry dashboard is among the easiest to customize and alter according to the changing needs of your business. Many industries use this dashboard type to gather crucial data for urgent decision-making and problem-solving. These types of dashboards vary widely based on an industry.
However, the most common ones are healthcare, marketing, and retail. Any healthcare sector analyzes critical data in massive amounts. Thus, a healthcare industry dashboard showing metrics like patient admissions and discharge rates, insurance claims, treatment costs, and staff allocations can simplify data analysis.
Marketing dashboards help teams improve the success of a sales campaign by examining data elements like the number of leads, cost for each lead, ROI, etc. Retail dashboards help those in the e-commerce and traditional brick-and-motor stores.
These dashboards streamline the analysis of inventory levels and profit margins by tracking data on sales, employee turnover, stock, net profit, etc. Retailers use this data to understand areas like customer engagement and retention.
Conclusion
Several types of dashboards are available for your choosing. Now it is up to you to determine the dashboard style that can suit your business needs. Remember to pick your key performance indicators carefully to ensure your dashboard makes sense.


