Dashboard vs report: what’s the difference between them? Which one excels at tracking the outcomes of your marketing campaigns?
In the world of marketing, data rules. Marketers must rely on insights and analytics from data when making decisions with short- or long-term impact. But how do you digest that data? Well, dashboards and reports are the two most powerful tools that can transform raw numbers into meaningful insights.
Although these two terms are often used interchangeably, they’re quite different. This comprehensive post delves deeper into the nitty-gritty of report vs dashboard and why understanding their differences matters.
What’s a Marketing Dashboard?
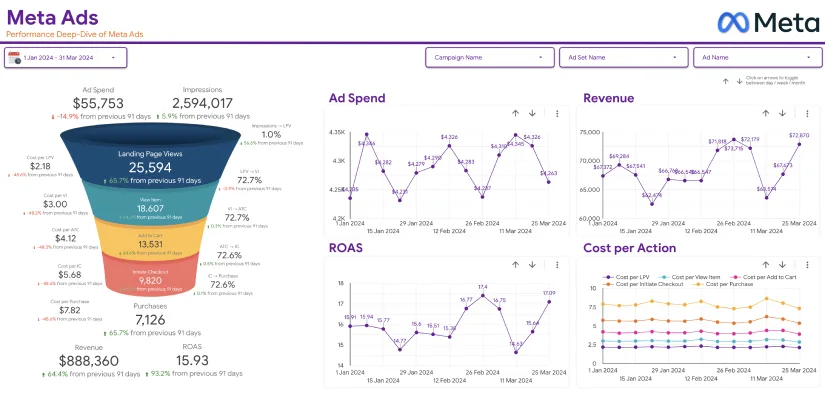
A dashboard is more like a window that shows you all your important metrics in a single place. Think of a marketing dashboard as a data hub—a central point that shows and updates your key metrics in real time. It uses different types of visualizations, graphs, charts, and metrics to make it easier to track your marketing campaigns.
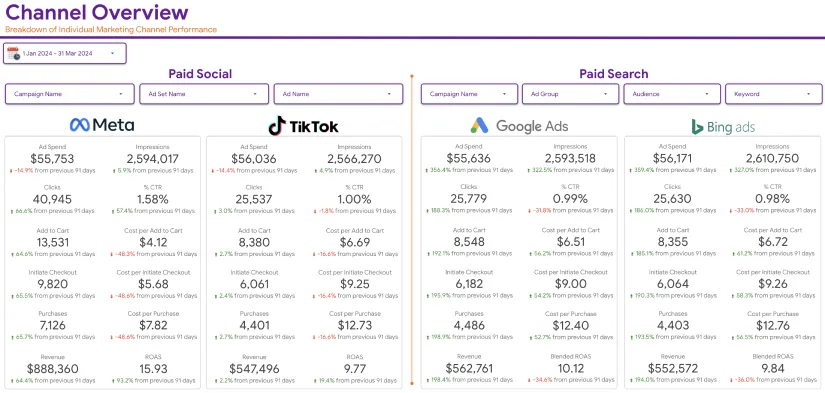
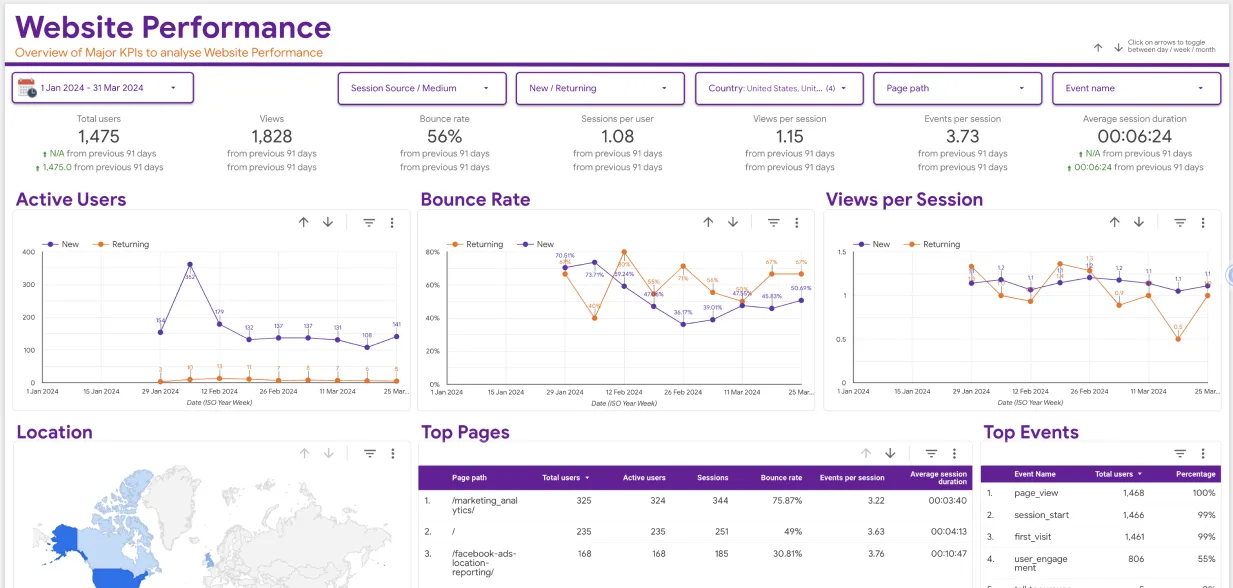
A dashboard can also be used to track social media metrics, website performance, and customer behavior. Their dynamic and interactive nature gives you a bird’s eye view of your Key Performance Indicators (KPIs) in one neat display.
Since dashboards display key metrics in real time, they’re often cloud-based, retrieving data from different sources. For this reason, they’re quite easy to share with your team or clients using a private URL.
Why Do Marketers Use Dashboards?
As a marketer, making fast data-driven decisions is your best bet at success. Dashboards offer instant access to highly valuable data without the need to go through endless spreadsheets. Everything takes place in real-time so there’s no waiting for hourly, daily, or weekly updates to know what’s going on.
Dashboards are important for spotting trends, evaluating performance, and making changes on the fly, whether you’re tracking your site traffic through Google Analytics or managing a Google Ads campaign.
Common Features of Dashboards

What features are you going to encounter when using a dashboard?
- Real-time Data: The essence of a dashboard is to give you a snap view of what’s happening at that very moment. The data is always current so you can use it to make important short-term decisions.
- Visualization: This has everything to do with the display of data in charts, graphs, maps, and so forth. They make it easier to spot a trend with just a glance.
- Customizable Metrics: The good thing with dashboards is that whatever metric you want displayed, you can have it. All you have to do is tailor it to show you the KPIs that matter the most to your marketing goals.
- Interactivity: The metric display is not static, but interactive. This means if you click on a metric, it’ll show you a detailed view of the data.
In summary, if you want to get a real-time update on how your marketing campaign is performing, you simply need to take a look at your dashboard. Next in this dashboard vs report post, we take a look at what’s a report and how it helps your marketing campaign.
What’s a Marketing Report?
On the flip side, a report is like a snapshot. Unlike dashboards that are dynamic, reports are static. But they’re similar to dashboards in that they bring together data from different sources to show detailed insights and analytics through graphs, charts, and lists.
Reports usually have a schedule in which they’re prepared, and this mostly depends on an organization’s preferences. The schedule could be weekly, monthly, or quarterly, which means they show static historical data. The key report vs dashboard difference is that while the latter shows an updated view of what’s happening, the former focuses on a specified timeframe and analyzes past performance.
Instead of logging into a system to view a report like it is with dashboards, reports are sent directly to recipients through email, mostly as PDFs.
How Are Reports Useful to Marketers?

Marketers value reports because they’re essential for detailed analysis and help a lot in long-term strategic planning. If you want to know what worked and what didn’t during a specific timeframe in your marketing campaign, you would normally get that in a report.
Reports allow you to analyze and refine your strategies. They’re mostly important to stakeholders, executives, marketing managers, or clients. They help them understand the return on investment (ROI).
Common Features of Reports
Here are a few features that define reports:
- Historical Data: Reports are crafted to show data from a specified period. They often provide context for evaluating a campaign’s performance.
- Structured Format: Most reports have a strictly defined format and, therefore, are less customizable compared to dashboards.
- Summarized Insights: Reports will highlight the key metrics and insights, so are ideal for presentations to stakeholders, teams, or clients.
- Long-term Focus: Reports don’t offer real-time monitoring, instead, are built for in-depth analysis that can benefit an organization in the long term.
Dashboard vs Report: How Do They Differ?
Now that we’ve made it clear what dashboards and reports are, let’s get to the juicy part: the key differences between them that set them apart.
1. Real-Time vs Historical Data
Reports contain a lot of details about historical data and, hence are ideal for analyzing past performances over a specific period. Think of a report as a Monday morning debrief of the previous week’s marketing efforts.
On the other hand, dashboards give updates as they happen in real-time. Whether you’ve just launched an ad, are watching traffic changes, or monitoring your conversion rates, dashboards will let you know what’s happening at the very moment.
2. Purpose
Reports serve the major purpose of analyzing what happened and are important in reaching conclusions. They’re what most marketers use to draw their plans and strategies.
Dashboards are important for keeping tabs on KPIs and making quick, well-informed decisions based on what’s currently happening.
3. Customization

In most cases, reports may only be customized before they’re drafted, after which they become static. There is no interaction with a report like you would with a dashboard.
Dashboards offer high-level customizations, allowing you to tailor the metrics you’d like to see and how they’re displayed. You can even set your dashboard to notify you when something changes in an unexpected direction.
4. Usage Frequency
Reports are often prepared and used at the end of a defined period. It could be at the end of the week, month, or quarter. You wouldn’t have to check a report daily.
On the other hand, dashboards show real-time data so they’re used every day, perhaps viewed several times a day. The frequency would depend on how closely you’re monitoring your campaigns.
5. Audience
Another key dashboard vs report difference is on the audience they serve. Reports are created for a broader audience, which may include stakeholders, team members, and clients. They offer a detailed overview of campaign performance without necessarily jumping into the nitty-gritty.
Dashboards are meant to be used by internal teams comprising marketers, analysts, and executives. They’re useful for making quick decisions that have a relatively short-term impact but are very important to a campaign’s course.
When Should You Use a Dashboard Vs Report?
Marketers use both to help them understand the course of their campaigns in the short-term (dashboards) and long-term (reports). If you decide to use dashboards and reports, it’s important to align them to your business logic.
But if you choose to rely on one over the other, you should base your decisions on the needs of your organization while using your business logic to determine how the tool is used.
When To Use a Dashboard
Use a dashboard when:
- You need real-time data: Dashboards let you monitor your campaign performance and track website metrics every second.
- You need immediate insights: When you want to stay on top of your campaign performance, a dashboard will help you achieve that, especially during important launches or high-traffic seasons.
- You need flexibility: The ability to customize what you want to be displayed or filter data on the fly makes dashboards quite handy.

Dashboards are the ideal tools for supporting the operations of marketing managers and executives in making crucial decisions.
When To Use a Report
Reports are useful when:
- You need a comprehensive analysis: Marketers rely on reports to get a long-term view of their marketing efforts.
- Presenting data to stakeholders: When doing presentations and you need a polished, structured format with a summary of key insights, go for reports.
- Performing performance review: Reports are essential in evaluating your past performances and coming up with detailed performance assessments.
Reports are handy when carrying out an in-depth analysis of your campaign’s specific aspect within a specified timeframe. They’re therefore important in exhaustively monitoring a thematic area over a required period.
Summing It Up
Both dashboards and reports play an important role and are essential tools in a marketer’s toolkit. However, they serve different purposes. If you want a real-time view of your key metrics, a dashboard is the go-to tool. On the other hand, reports are ideal for long-term strategy and analysis since they review historical data. Understanding dashboard vs report unique strengths allows you to optimize your data monitoring and ensure you’re always ahead in your marketing efforts.
At Eaglytics Co., we can help you harness the power of your data through powerful dynamic dashboards and insightful reports. Let us help you implement data-driven marketing strategies with the help of professional dashboards and reports and change how you view your marketing campaign performance.