In today’s data-driven world, having access to meaningful insights is key to making informed decisions. Google Data Studio templates have become essential for businesses and analysts seeking to turn raw data into compelling visual stories. However, creating practical and visually appealing templates that enhance data storytelling requires a strategic approach. In this guide, we at Eaglytics will walk you through the best practices to design templates that captivate your audience and ensure clarity and usability.
Why Google Data Studio Templates Matter
Google Data Studio is a free, powerful tool that enables users to create customizable dashboards and reports from multiple data sources. Templates are pre-designed layouts that save time, promote consistency, and make complex data accessible. A well-designed template can:
- Simplify data interpretation for stakeholders.
- Promote consistent branding across reports.
- Enhance collaboration by standardizing reporting formats.
- Streamline the reporting process for recurring projects.
Following the best practices outlined below, you can ensure your Google Data Studio templates are functional and aesthetically pleasing.
1. Define Your Goals and Audience
Before diving into design, it’s crucial to identify the purpose of your report and understand your audience. Ask yourself:
- What story does this data need to tell?
- Who will be using or viewing this template?
- What level of detail is necessary?
For example, a sales team might need high-level metrics like total revenue and sales growth, while a digital marketing team may require granular data like click-through rates and conversion paths.

2. Choose the Right Data Sources
Google Data Studio integrates with various data sources, such as Google Analytics, Google Ads, BigQuery, and third-party platforms. To create a seamless and informative report:
- Select data sources relevant to your goals.
- Ensure data is clean, accurate, and updated.
- Use connectors to automate data fetching, reducing manual effort.
3. Prioritize Simplicity and Clarity
The best Google Data Studio templates are easy to understand. Avoid cluttering your dashboards with unnecessary metrics or visual elements. Focus on:
- Minimalism: Use white space effectively to reduce visual fatigue.
- Hierarchy: Organize data by importance, placing key metrics at the top.
- Labels: Clearly label charts, graphs, and tables for better comprehension.
4. Incorporate Visual Storytelling Techniques
Data storytelling is about presenting information in a way that engages your audience. Use these techniques to enhance your templates:
- Color Coding: Use consistent color schemes to highlight trends or categories.
- Comparison Charts: Show changes over time with line graphs or bar charts.
- Callouts: Add text boxes to explain key takeaways or unusual patterns.
Remember, visuals should complement the data—not overshadow it.
5. Leverage Pre-Built Google Data Studio Templates
If you’re short on time or looking for inspiration, Google offers pre-built templates for various use cases. These templates:
- Provide a foundation you can customize.
- Offer insights into practical layout and design strategies.
- Reduce the learning curve for beginners.
Popular pre-built templates include Google Analytics Overview, YouTube Channel Report, and E-commerce Dashboard.
6. Focus on Branding
Consistent branding strengthens your reports’ professional appeal. Customize your Google Data Studio templates to reflect your organization’s identity:
- Use your company’s logo and colors.
- Choose fonts that align with your brand guidelines.
- Standardize design elements across all reports for a cohesive look.
7. Optimize for Mobile and Cross-Device Compatibility
More stakeholders are accessing reports on mobile devices. Ensure your templates are responsive and display well on smaller screens by:
- Using a single-column layout for mobile views.
- Testing your template on various devices and resolutions.
- Avoid overly complex visuals that may not render correctly on mobile.
8. Incorporate Interactive Features
One of Google Data Studio’s standout features is interactivity. By enabling interactive elements, you empower users to explore data on their terms:
- Date Range Controls: Allow users to adjust the period of the data displayed.
- Filters: Enable filtering by location, campaign, or other dimensions.
- Drill-Downs: Let users click on a metric to view more detailed information.
These features make your templates more engaging and reduce the need for multiple static reports.
9. Use Advanced Visualization Options
Beyond basic charts and tables, Google Data Studio supports advanced visualizations that can make your data stand out:
- Heatmaps: Ideal for showing intensity or frequency within datasets.
- Bullet Charts: These are useful for comparing performance against a target.
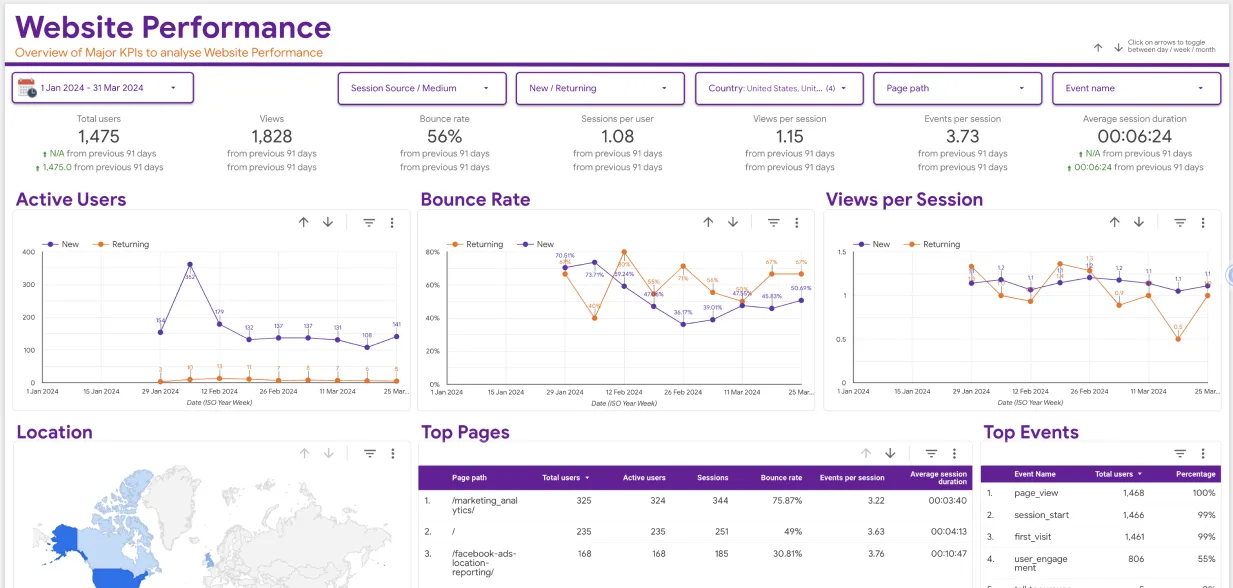
- Geographical Maps: Excellent for location-based metrics.
Experiment with these options to find the best fit for your data.
10. Test and Iterate
Even the most well-thought-out template can benefit from feedback and fine-tuning. Before rolling out your template:
- Share it with a small group of stakeholders for input.
- Check for any data inaccuracies or formatting issues.
- Continuously update the template based on new requirements or data sources.

11. Monitor Performance and User Engagement
Once your template is live, track its effectiveness. Use feedback and analytics to understand:
- How often is the template used?
- Which sections are most viewed or interacted with?
- Whether the template meets its intended goals.
This ongoing process ensures your templates remain relevant and valuable.
Examples of Well-Designed Google Data Studio Templates
To inspire your designs, here are examples of effective templates:
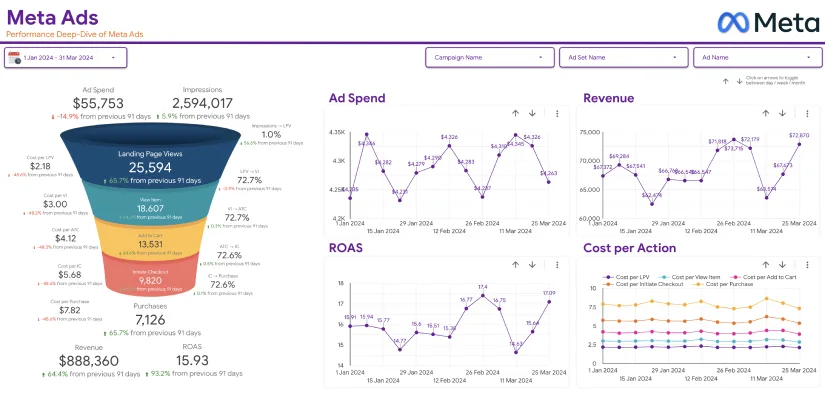
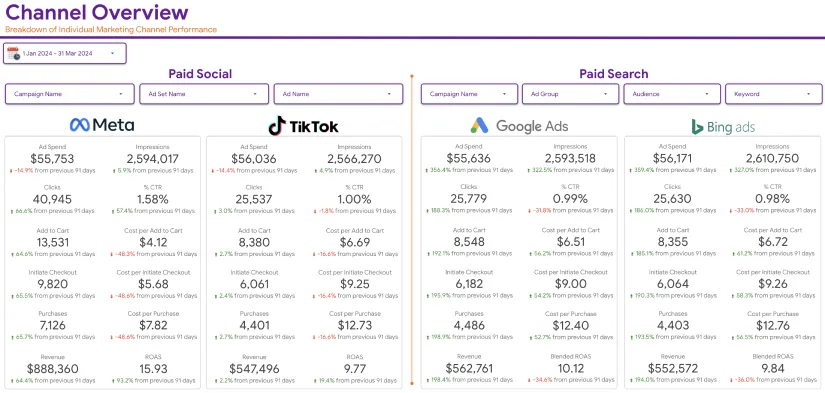
- Marketing Performance Dashboard: Combines SEO, PPC, and social media metrics into a unified view.
- E-commerce Sales Report: Tracks product performance, revenue, and customer behavior.
- Customer Support Dashboard: Monitors ticket resolution times, customer satisfaction scores, and agent performance.
These templates demonstrate how to balance aesthetics with functionality.
Final Thoughts
Designing effective Google Data Studio templates is both an art and a science. By focusing on clarity, interactivity, and storytelling, you can create templates that resonate with your audience and drive better decision-making. At Eaglytics, we’re passionate about helping businesses unlock the full potential of their data. Whether you’re just starting with Google Data Studio or looking to refine your reporting process, these best practices will set you on the path to success.Start creating your templates today, and watch how impactful data storytelling transforms your business. For more tips and insights, stay tuned to Eaglytics!