Being the largest social media network with over two billion monthly active users and more than 2 trillion ad impressions every month, Facebook is every Digital Marketers’ first destination and thus, building a Facebook ads dashboard on google data studio comes in handy.
Facebook provides an easy-to-use interface for marketers to create highly customizable ads and targeted to specific audiences on Facebook. However, marketers have a hard time understanding their audience data because it’s not organized clearly or allows you to easily explore insights from different angles.
The Facebook Ads Manager is designed to help business owners and marketers get as much information about their Facebook advertising efforts. Still, it has many limitations like being difficult to navigate, only showing Facebook-specific metrics, and not providing actionable insights in a single view.
In this blog post, we’ll show you how to build a Facebook Ads Dashboard on Data Studio so that you can visualize your ads or your client’s ads in a single dashboard and make quick, meaningful decisions.
1. What is Google Data Studio?
Google Data Studio is a totally free data visualization and reporting tool from Google that helps you create, share and embed interactive reports on the web. You can use it to make simple dashboards with just a few clicks.
Google Data Studio integrates with third-party APIs so you can easily access live data about your Facebook Ads campaigns anytime you want.
While we are focusing on creating a dashboard for Facebook Ads, you can just as easily create dashboards for other ad platforms like Twitter and Linkedin and all other google owned platforms. Thus, you can create a single source of truth dashboard for your company and automate reporting with your clients.
2. What is the Need for Building a Facebook Ads Dashboard on Google Data Studio?
While Facebook provides a ton of valuable information about ads, our Google Data Studio templates solve the shortcomings of the Facebook Ads Manager by providing a robust dashboard that is easy to use and provides information in the most useful way possible.
A Facebook Ads Dashboard allows Facebook marketers to view all Facebook accounts they’re managing and Facebook ad campaigns in one place. It’s particularly helpful when you’re working with multiple clients or have a complicated Facebook Advertising account.
Not only will you have better insights by connecting facebook ads to google data studio and building a Facebook Ads Dashboard, but you will also save anywhere between 10-20 man-hours per month spent on copying the data to an excel sheet and creating reports to be shared with your clients/team.
The teams that we have worked with have all seen a minimum of 20 hours saved each month, while a few of them are saving 40+ hours each month by investing in creating automated reporting dashboards.
3. Why Use Google Data Studio for Marketing and Advertising Campaigns
While Facebook offers its own Facebook dashboard for advertisers, you can use Google Data Studio to visualize not just Facebook Ads Insights but also metrics from other Social Media Ad Platforms, making it a one-stop dashboard for Facebook, Instagram, Google, Twitter, and YouTube.
Not only that, Google Data Studio allows you to create dashboards that can be shared with others on your team or company. It also offers the capability to analyze Facebook ads data and see what’s working and what’s not.
Advertising in the digital age has been a boon for those who could move quickly and adapt. Using a service like Google Data Studio just makes the whole process a whole lot more convenient and will help you get the most out of your Facebook advertising campaigns.
4. How to build a Facebook Ads dashboard on Google Data Studio

As amazing as Google Data Studio is, it only connects with Google’s platforms, like Google Analytics, Google Adwords, and Google My Business.
To build a Facebook Ads dashboard template on Google Data Studio, follow the steps below:
Step 1: Login to Data Studio and click ‘Create’ on the left and select ‘Report’.
Step 2: A panel with 2 tabs ‘Connect to data’ and ‘My Data Sources’ opens. My data sources is used to connect to existing/sample data sources and Connect to data to connect any new data sources. Select ‘Connect to data’
Step 3: Now, you’ll have to use a ‘Connector’ to connect Facebook Ads to Google Data Studio. You’ll either have to use a third-party API connector or build your own API connector.
Once you decide on a connector, select the type of data source you want to visualize, in this case Facebook ads data, then provide your Facebook account details and click ‘Add’.
Step 4: Select the data points you want to add and change the style of the report according to your brand from the properties panel.
With Google Data Studio, you have the option to add more data sources to your report, making it more versatile and actionable.
Here’s a summary of the differences between various third party API connectors to help you decide on the best course of action:
Of the various 3rd party API connectors, the ones worth considering are:
I. Supermetrics
II. Stitch
III. Fivetran
| Supermetrics | Stitch | Fivetran | Our Connector | |
| Cost | €99 to €299/mo, paid annually | Starts at $100/mo | Pay per use ranging from $1/credit to $2/credit | Free, when you buy our dashboard which starts at $100/mo |
| Pros | Well reputed and has lesser breakdowns Multiple data sources | It has minimal breakdowns Lots of data sources are available and is a known entity | Has stable pipelines and is renowned The data is available from a number of sources | No need to buy external connector Load speed of dashboard is very high as we only select the data that is important to your business More reliable and robust with load Helps you create very customized dashboards |
| Cons | Hefty subscription fees Build and maintain the dashboard on your own | Expensive Has to be built and maintained manually | Costly Maintenance and building needs to be done on your own | We only capture specific columns to make the dashboard run optimally |


We at Eaglytics provide automated single source of truth reporting dashboards for Marketing Agencies for all the marketing channels and can help you save the cost of using a third party API connector by using our in-house API connector at no additional charge to you.
5. Creating an Effective Facebook Ads Dashboard on Data Studio
A great dashboard is only as useful as the insights it provides, so it is very important that you choose the metrics that help you make decisions.
Data that is being visualized in a dashboard, instead of just looking at numbers, can help Facebook advertisers like you make quick decisions on what to do next.
A good dashboard should include the following elements:
- All the business questions that you want answers to
- All the major KPIs that help you make decisions
- All segmentations that are used in the decision making process
Please read this article for a detailed understanding of the important KPI metrics to track while building a facebook ads dashboard in data studio and why.
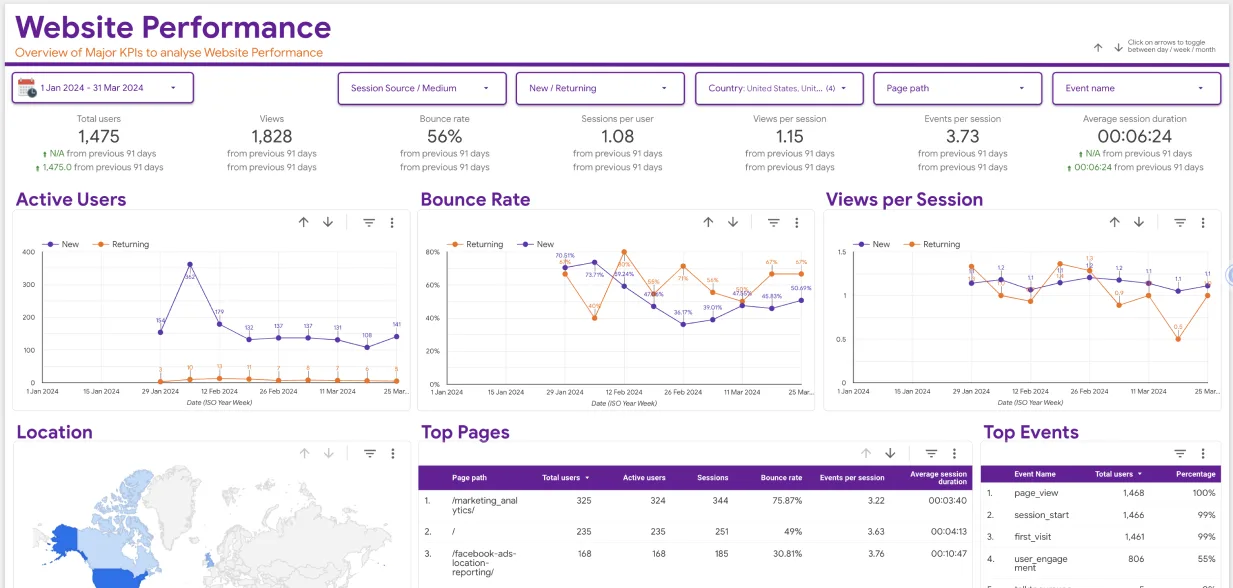
6. Examples of What Your Facebook Ads Manager in Data Studio Dashboard Could Look Like:
We can talk about this till we’re blue in the face, but nothing does a Facebook Ads dashboard justice like seeing one.
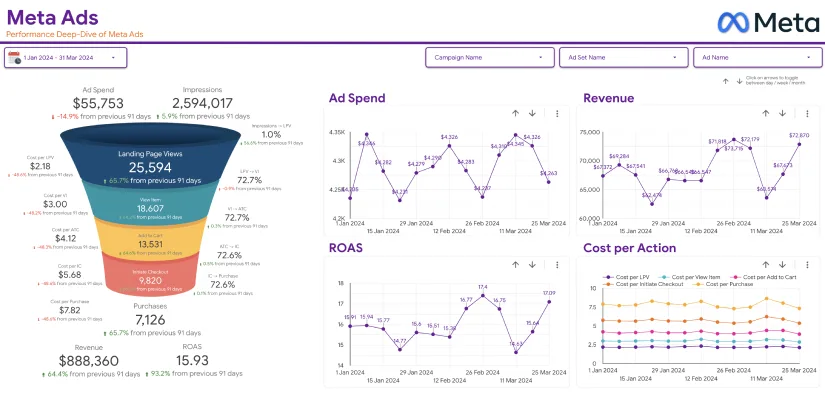
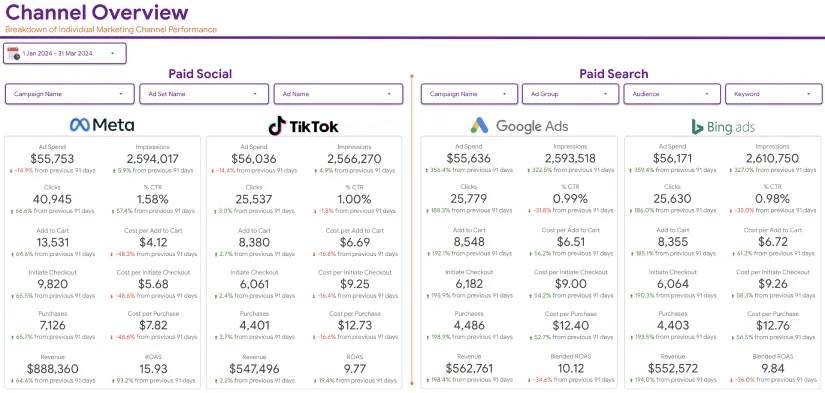
Here is a small glimpse into what your Facebook ads dashboard could look like compared to the Facebook Ads Manager Dashboard:
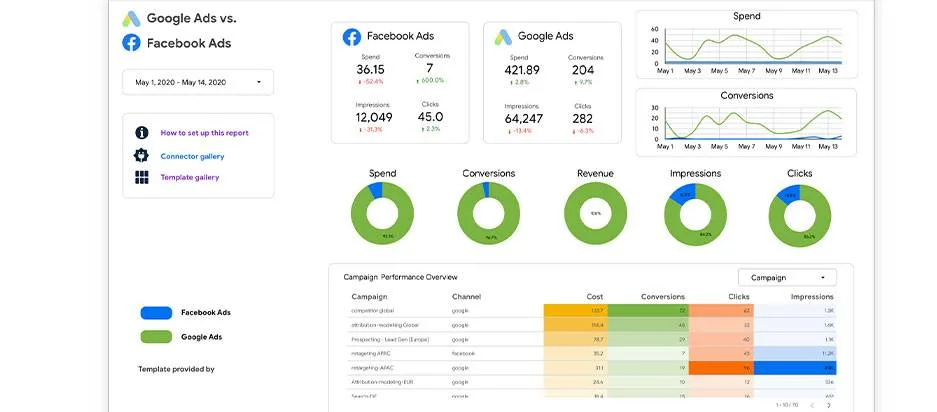
And yes, you can customize these dashboards to your brand colors too.
7. Saving Hours Each Month Using a Facebook Ads Dashboard:
Facebook provides a ton of valuable information about our ads, but Facebook Ads Manager falls short in providing marketers with the right tools to easily make quick, meaningful decisions.
We’ve shown you how to build a Facebook Ads Dashboard on Google Data Studio so that you can visualize your own Facebook Ads or those of your clients and automate reporting making it easy to make quick, meaningful decisions.
If Facebook is a marketing channel for your company, then we can help you get the most out of Facebook Ads by building a Facebook Ads dashboard on Data Studio.
Contact us today to save yourself hours each month by automating the reporting of Facebook ads on Google Data Studio.
Related Articles


