Nowadays, marketers are utilizing every opportunity possible to reach their audience and drive conversion online. Undoubtedly, customers usually visit a particular website at least once before purchasing. Therefore, you need to assign the right value for every marketing channel you design to take. Google ads attribution reports are great to bring customer insights and measure advertising efforts. Here in this guide, we’ve shared everything you should know about google ads attribution reports. keep reading!
Typically, Google ads attributions aim to help marketers in three ways. Firstly, it properly credits marketing sources and mediums, quantifies interactions’ value, and informs bidding decisions based on the final funnel attribution data. In this write-up from Eaglytics Co, you will learn everything you should know about Google attributions.
What is Google Ads?
Google Ads is a unique online advertising program that enables you to create ads online to reach an audience interested in your product and services. It runs on pay-per-click advertising, meaning you only pay whenever visitors click your ad online. It offers both small and big businesses a level ground to undertake affordable online advertisement that suits their brand.
Google Ads Attribution Models
Before we look at the Google ads attribution reports, let’s talk about some of the models marketers use to capture customers during the conversion process.
Last-click Model
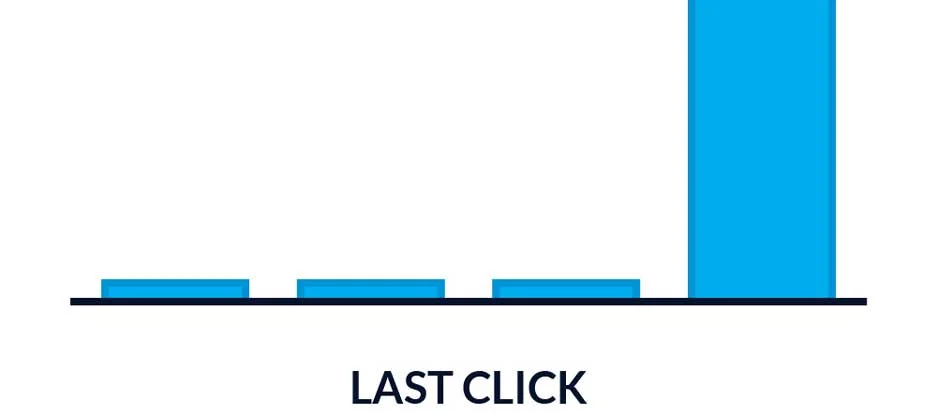
The last-click model represents the default Google Ads attribution models. It is the default Google Analytics and Google Ads setting, especially if you set up a campaign and have never tweaked the attribution settings. The model gives credit for sales, conversions, or any goal to the last clicked ad or keyword.
For instance, if you have ten different ads running and they eventually convert on your food remarketing campaign, the food campaign gets the credit for such sales. Does that seem right? Don’t be so fast. The last-click is not the entire story behind this because when you look at your Google Analytics, you will see several “Direct” conversions when using the last-click model.

There are several reasons for this to happen. Here is how conversion works with digital marketing.
First, a customer’s searches online and finds you through an unbranded search. He reads the blog post you shared on social media platforms (Facebook, Twitter, LinkedIn, and Instagram). He searches again, and you pop up through an unbranded search again. Now, he types your URL directly and visits your website before converting.
Although it looks like an abbreviated version of the buying process, everything remains the same. For customers’ to convert, you have built a solid brand awareness, which makes them type your website address on their browser and convert.
However, when you want to analyze data, this isn’t helpful. Using the last-click model will only indicate that your social ads didn’t perform optimally. Although it is a good model, it doesn’t tell the complete story.
First-Click Model
Like the last-click model, the first-click model only gives credit to the keyword or channel that generates the traffic to your website.
For instance, you ran a search to target a particular keyword in your industry. You create a link, but the customers decide not to purchase that particular day. Therefore, you do a remarketing ad through the search result and get another click. This remarketing helped to convert the customer.
When looking through your data and Google Analytics, the credit will be given to the customer’s initial keyword. The issue here is that the first click sparked their attention, but it didn’t work as it ought to. If it requires multiple keywords for your customers to convert, it means the first keyword wasn’t high-intent.
The best scenario to use the first-click model is when you want to focus on your brand awareness and funnel engagement. The model shows you target a particular audience with a strong keyword that generates awareness. However, the first-click model isn’t the best in terms of conversion.
Linear Model

Besides the two models mentioned above, we have the linear model that distributes credit to every customer’s interaction before making a purchase. For example, you did a multi-level campaign that drives funnel clicks through remarketing, search, and remarketing through RLSAs. Your report would provide equal credit to all three strategies used.
The linear model provides a better picture of the keywords and channels that worked or didn’t work. It only gives credit to the keyword or channel that gets clicks. A linear model is ideal, especially if you run a complex campaign that requires people to take broad organic searches.
Time Decay Model
This model gives credit to actions that take place before the final conversion. Therefore, if a user takes within 9 to 15 touches to convert but spreads across months, the last few touches before the conversion will take the credit. The model is the best option if you are running a long and complex campaign. Overall, the model helps you understand the duration of your sales process. However, if you want a simple Google Ads campaign, this model won’t be the best option.
Position-based Model
For collecting data, we regard the position-based model as the overall best. It gives 40% of conversion credit to the first and last touches, whereas 20% to other clicks within the buying journey. It offers more concrete data than the last and first-click model because it provides information about the ad or first keyword that drew attention, the keyword that closed the deal, and the keywords or clicks that helped complete the customer’s journey.
Therefore, when is the best situation to use the position-based model? It is ideal when you are looking for the right combination of closing and brand awareness. It can help you create awareness and close the deal simultaneously.
Data-Driven Model

The last model is the data-driven model, which is a new addition. The model uses Google machine learning technology to assign credit to the most influencer keywords during the conversion process.
It is based on account performance and is not meant for everyone. Interestingly, it requires you to use this model. The main requirement is to have 3000 clicks and 300 conversions within 30 days to be eligible for this model. If you don’t spend over $2000 a month for your Google Ads, you don’t have access to the data-driven model. Remember, it is an automated model that can come in handy in your online marketing.
Google Ads Attribution Reports
The Google attribution report shows the number of conversion events driven by ad network and source. Alternatively, it enables marketers to quantify every traffic source contributing to sales and conversion. It assigns credit for sales and conversions through a user’s conversion journey.
The Google Ads attribution reports provide sufficient insight for a marketer. Today, we live in a world with several complexities. Online marketers are facing severe challenges in assessing the value of their campaigns. You might use Google AdWords to visit a website at a particular time; the next time, it might be a banner ad. The ability to measure these different campaigns is critical. Here is where attribution reports come in handy.
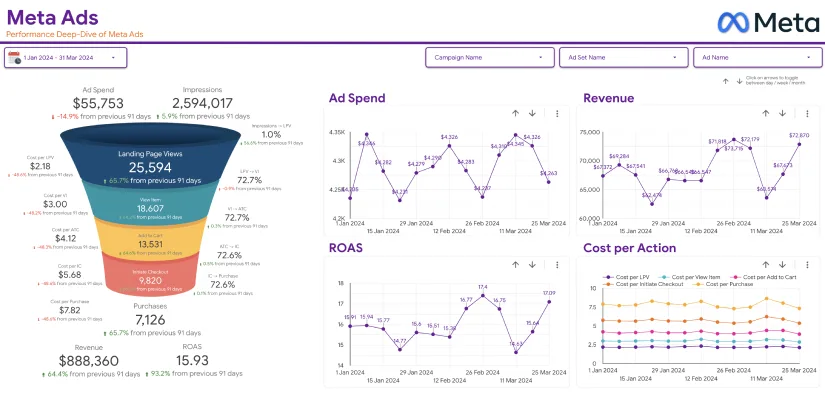
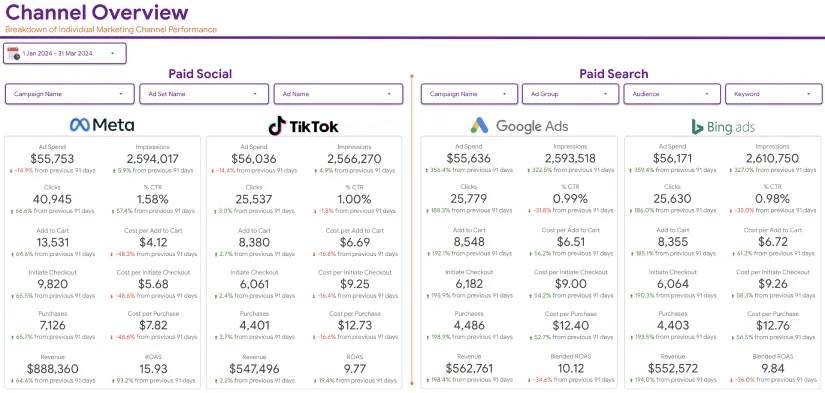
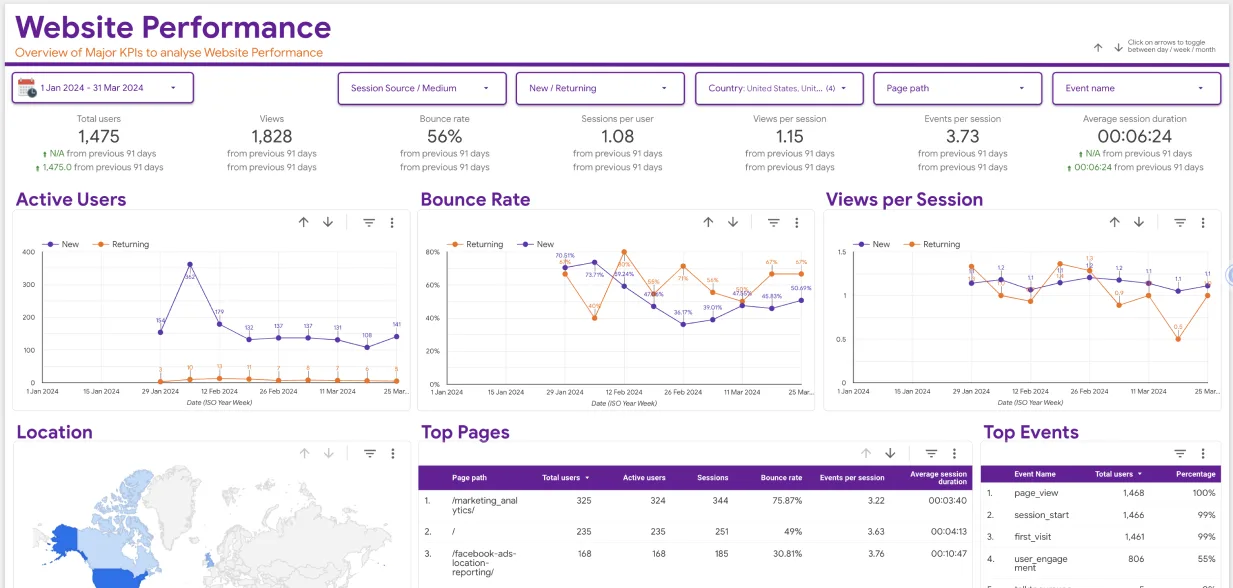
By utilizing Google Ads dashboard templates, you can create customizable dashboards that visualize and interpret your attribution data. These tools make it easier to track performance, refine your strategies, and ensure your campaigns are achieving their intended outcomes.
When analyzing your reports, there are essential things to look at for. Let’s briefly look at these items in your attribution reports.
Attribution overview
It is the starting point since it tells you the number of conversions you got from your campaign, the ad impressions and how many days the ad too. It provides an insight into your marketing campaign. It provides detailed information about top conversion actions, Ad clicks per conversion, days to conversion, conversion value, and the ad impressions per conversion.
Assisted Conversions

The report covers the number of conversions your advertising helped with. It is the best place to get your keyword to work as it can create a lot of awareness for your brand, especially in areas where your last click didn’t perform well. The report provides impression-assisted conversions and click-assisted conversions created by a keyword, adgroup, campaign, and match type.
Cross-device activity
This report shows the device your customers are using to access your campaign. We live in an ultra-connected world with multiple platforms, and having a device path report is crucial to your business. You would want to know how your customers interact and what means they do that.
For example, you may find out that many of your conversions take place from smartphone to tablet to desktop. This would allow you to adjust your campaign and create unique ads for each device. Extra spending can help create the conversion by telling what device your customers’ use.
There are three reports you can get from your cross-device activity, including devices reports, assisting devices reports, and device paths report. The devices report looks at the particular interaction device such as Tablet, Mobile, and desktop through which the users access the ad.
The assisting devices report allows you to determine the last click conversion, click-assisted conversion value, last-click conversion value, impression-assisted conversion, and so on for each device. However, the device paths report shows the top cross-device conversion paths while allowing you to decide the order of the different devices customers use before conversion.
Paths
This Google ads attribution report shows the typical path that your buyers follow. It enables marketers with attribution modeling. With this report, you can adjust the path and make it more efficient to generate more leads and conversions. In this area, you should look at the average session lengths, bounce rates, and new visitor sessions when looking at the top path report.

Google ads allow you to view three paths reports for your ads. The top paths report shows your top conversion path – it looks at the conversion value or conversion volume. The time lag report allows you to determine the time it takes for a customer to complete the conversion process after visiting your website. Lastly, the path length report enables you to determine the ad impression your visitors take to complete the conversion process.
Click Analysis Report
The report allows you to determine the ad groups, campaigns, and keywords you started and completed during the conversion process. It provides two analyses, the first and last click analysis report.
Attribution Modeling Report
The report compares two different models and determines the conversion action for each model. You can ascertain if a keyword, adgroup, Device, match type, or Google Ads account is overvalued or undervalued under the model.
Conclusion
Google Ads attribution report is an essential tool that provides relevant data in your online marketing efforts. Besides tracking Facebook ads in Google Analytics, you need to report all your online campaigns. Google Ads attribution report provides a detailed overview that can help you strategize your campaign.
At Eaglytics Co, we offer several products and services to improve your campaign. Our unique GDS templates can help you to bring customers insight and measure your marketing performance. You can easily create Facebook Ads reports, Google Ads reports, Google Analytics dashboards, and Klaviyo dashboards.


