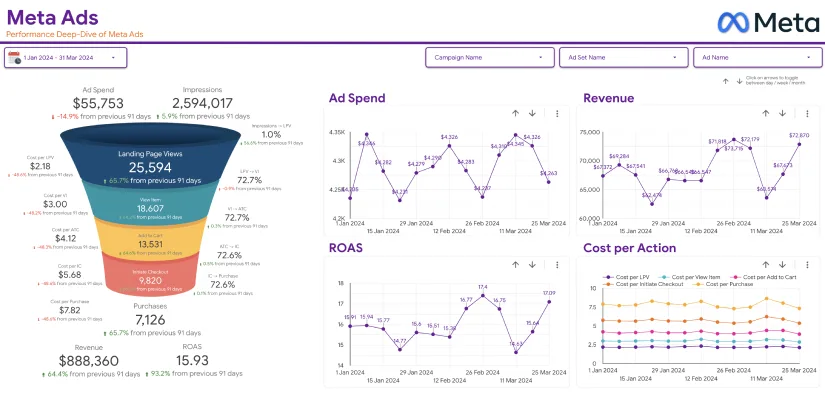
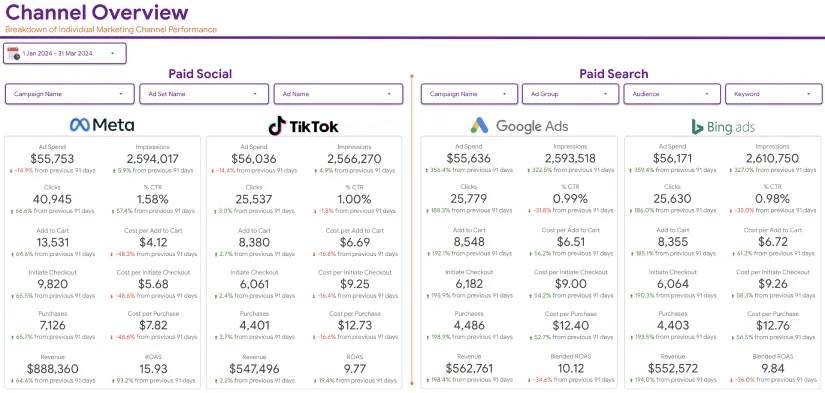
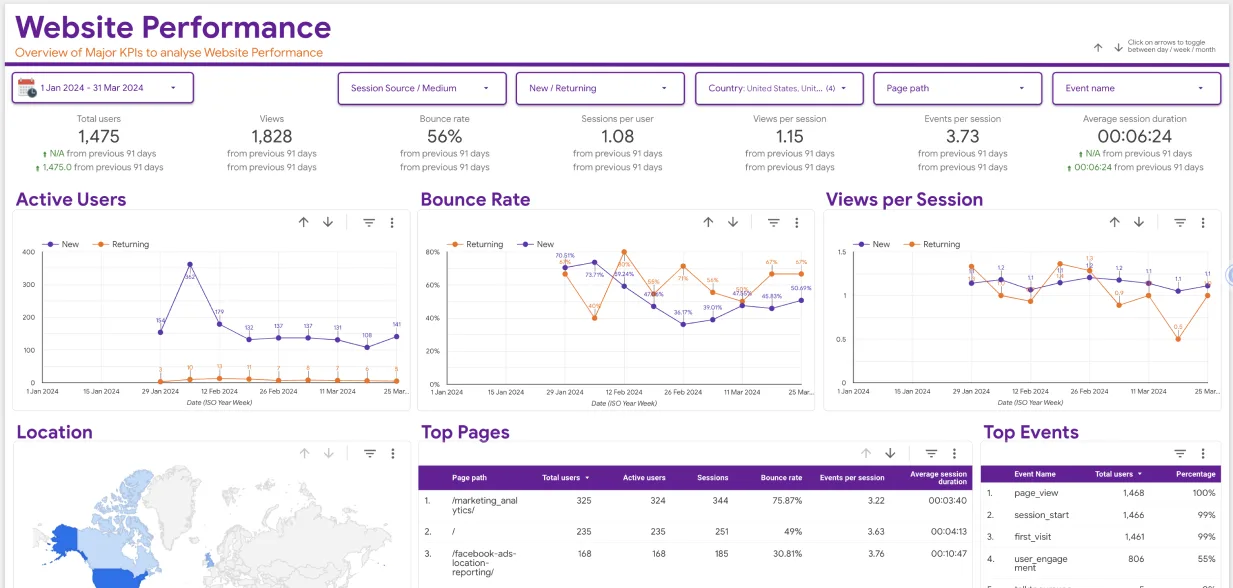
Google Data Studio, which is known nowadays as Looker Studio, is an online platform that allows users to create data visualizations from different data sources. It lets you create various types of reports, including SEO reports.
SEO reports are used to describe the performance of a website in terms of the clicks and impressions it gets from search engines. These reports can also contain information about which keywords the site ranks for, the pages that have the best performance, which devices are used to access it, and so forth.
In this post, we’re going to guide you on how you can use Google Data Studio for SEO reporting. This guide will be very helpful for you if you want to create reports for your clients or simply for your own perusal.
What is Google Data Studio?
We did start off this post with the definition, but let’s delve into a bit more detail.
Google Data Studio is one of the many tools that Google provides to its users. Just as Gmail and Drive are used for sending emails and storing files respectively, Google Data Studio is used for creating data visualizations and reports.
When you visit Google Data Studio, you can find an array of different templates for creating reports. For example, you can find:
- GA4 Report (Google Analytics 4)
- Search Console Report
- Google Ads Report
And so on.
You can create your own reports from scratch if you don’t want to use a template, but they do make things easier.
Here, we’ve attached a screenshot below so that you can understand where you need to find yourself:

Like all of the other services by Google, Google Data Studio (or Looker Studio, as it is called now) is free to use and simply requires you to have a Google account.
How to Create SEO Reports in Google Data Studio?
Now let’s talk about the exact steps that you have to follow to create SEO reports in Google Data Studio.
1. First step: Open Looker Studio
To get started, you need to open Looker Studio.
You can simply click on this URL: https://lookerstudio.google.com/
Or, you can do a Google search and click on the result that shows at the top.

2. Second Step: Click on “Create New Report”
Once you are at the home page, click on the button that says “Create New Report.”

Note: After you have created your first report, this button won’t show up here. In that case, you can create a new one by clicking on the “Create” button on the left-side menu.

3. Third Step: Set Up Your Account by Providing the Necessary Details
When you click on the “Create New Report” button, you will be prompted to set up your profile before you can proceed.
- Enter the name of your country
- Enter the name of your company
- Check the box that says “I agree to the terms and conditions”
- Then click on “Continue”

4. Fourth Step: Once Your Account is Set Up, Connect Your Data Source to Google Data Studio
After you add the country name and company name and select your update preferences, you will be once again taken to the home page and prompted to continue your previous action.
Click on the “Create New Report” button again and a blank document will open. As soon as the document opens, a popup menu will appear on the lower half of the screen where you will be told to connect a data source so that the data can be imported.

Here, you can select the data source that you want to use for the reports. For example, you can click on the “Google Analytics” button if you want to fetch the SEO report data from GA. On the other hand, if you want to fetch the data from Google Search Console, scroll down till you find it and then click it.
5. Fifth Step: Authorize the Data Source Connection
When you click on your required data source, you will be prompted to authorize the connection. For example, for this tutorial, we were setting up a report for one of our websites, and when we clicked on “Google Search Console,” here is what the prompt looked like:

Click on the “Authorize” button and a window will pop up where you will have to sign in to your Google account for verification purposes.
Once you sign in, you will be asked to select the types of data that you want to import. For example, with Google Search Console, it asked us whether we wanted to see site impressions or URL impressions, whether we wanted Web impressions Images, News, Video, etc.
Here is a screenshot showing you can make the selections:

After you have made the selections, click on the “Add” button.
You will be given another confirmation prompt to let you know that the data will be added to Looker Studio, how users can utilize the data, etc. Read all the fine print and then click on the blue button to get started.
6. Sixth Step: Add and Customize Your Data
Now, the data will be imported to Google Data Studio and you will be able to see the basic information displayed on the document. Here is a screenshot of what it looks like:

You can customize and add more data by using the provided functions. For instance,
- You can click on the “Add a Chart” button to add more data visualizations to the board. We added a “Combo Chart” that you can see in the screenshot. There are many different choices that you can pick from.
- You can click on each of the charts to customize them. There are many fine details that you can add and change in the charts. You can see in the screenshot that there are many different options on the right side of the screen for adding and modifying the data shown in the table.
- You can also edit the styling and appearance of your report by clicking on the “Theme and Layout” button in the ribbon (top menu). Google Data Studio also gives you an option to add images, lines, shapes, and texts to the report.
- By clicking on the “Add Page” button, you can insert another page in your report.
- The “Add a Control” option lets you add elements such as drop-down lists, data filters, checkboxes, etc., to the report to make it more interactive.
7. Seventh Step: Once You Are Done, Share the Report with Others
After you have made the report and customized the elements/information all you want, you can share it with others. The sharing function works the same way as with other Google services such as Docs and Sheets.
- You have to click on the “Share” button at the top right corner.
- Then, you can enter the email addresses of the people with whom you want to share the file.
- You can also just copy the link and adjust the sharing settings to allow users to view or edit the file.

What are the Benefits of Creating SEO Reports Using Google Data Studio?
There are many different benefits of creating SEO reports using Google Data Studio. Here are some of the main ones to keep in mind:
- With Google Data Studio, you can add multiple data sources to the same file and create a combined SEO report showing different types of site performance metrics. For example, you can add Google Analytics and Google Search Console to your report and fetch data from both sources to make a comprehensive and elaborate visualization.
- Google Data Studio allows you to extensively edit the reports by adjusting fine details, such as how the data should be displayed, what exact metrics have to be shown, how the data has to be sorted or filtered, and so forth. The extensive control over all aspects of data is, quite frankly, awesome.
- You can edit and customize the appearance of the reports to align them with your brand’s theme and aesthetic. If you are making the reports for, say, a big client meeting, you can customize its looks to show you’ve put effort into it. Plus, all the customization options can be used to make the reports more understandable and easy to peruse.
- The reports created by Google can be easily shared with others. You can simply send a URL and have others join the file to make changes or simply view it.
Wrapping Up
And with that, we’re going to bring this post to a close.
Creating an SEO report with Google Data Studio is quite easy and it has a lot of benefits. We’ve mentioned all the steps above with illustrations so that you can follow them without any problems.
We hope you enjoyed reading the post and we hope that now, at the end of it, you have your first report all ready and done. There are a lot of upsides to Google Data Studio SEO reports, and you will start to notice them when you share them with your clients or higher-ups…or even just view them if you’re the webmaster yourself.


