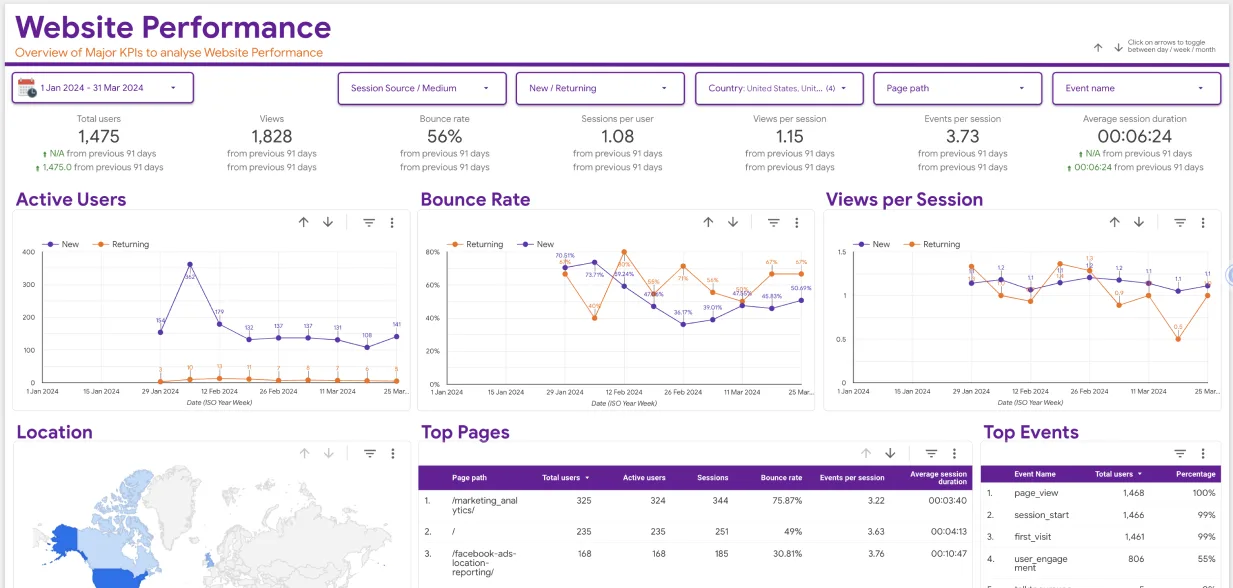
Due to the complexities of digital marketing in 2024, almost every marketer out there is searching for an answer to how to build client marketing dashboards. There are social media stats for platforms like Facebook, Instagram, Twitter etc. You also have Search Console and Google Analytics, which function as the bedrock of your web analytics. Plus, you still need to track the performance of SEO using SERP tracking tools, which generate site audit data to help you monitor your marketing page’s performance.
Clearly, there’s a lot on your plate to make sense of when building a marketing campaign. Depending on the specificity of your campaign, you’ll need to use various key metrics and adjust KPIs based on your choice of tools. For instance, those using Klaviyo may have to track data on emails. With so much to keep track of, it eventually becomes incredibly difficult to keep track of the metrics that matter. And that’s where a marketing dashboard comes in.
What’s A Marketing Dashboard?
Without a marketing dashboard, you’ll find yourself going through numerous spreadsheets and opening various platforms and apps to individually access each key metric. With one, you can easily streamline your processes and gain lots of insights from your marketing analytics data.
So, this brings us to the question, what’s a marketing dashboard? A marketing dashboard is a platform that gives you a unified view of selected marketing performance and analytics data. The good thing about marketing dashboards is that you can customise them to show specific information on your choice of project data or KPIs.
Wondering how to create a marketing dashboard? Well, you need the right tools in your tool stack. Luckily, most marketing management software tools allow you to create dashboards, just like the all-powerful and free marketing analytics giant, Google Analytics.
The Blueprint: Know What You’re Building

A successful marketer knows how to make use of a marketing dashboard to elevate their growth and that of their clients. So, before hopping onto the bandwagon of favourite colours and fonts, you need to understand what the heck you’re building. Just like building a house, you need a blueprint to help you create something that will not only impress your client but serve the purpose well.
Step 1: Understand The Needs of Your Client
What is the client interested in and want to see in the dashboard? But more importantly, what do they need to see? There’s a big difference, trust me. A marketing manager is more interested in campaign performance metrics such as click-through rates (CTR) and conversion rates. A CEO on the other hand, is more concerned with high-level KPIs like customer acquisition cost and ROI.
Tailor your marketing dashboard to meet your audience needs—don’t just throw every metric you think is important into the mix.
Step 2: Define the Key Metrics
Another crucial aspect of how to build client marketing dashboards is to properly define the important metrics. After determining what your customer cares about, define the metrics to vividly tell the story. Imagine metrics as the ingredients of a recipe. Tew few, your dish becomes bland and too many will turn it into a mess.
Some important metrics to consider include:
- Website traffic: Since everyone loves to see that little traffic arrow pointing up.
- Conversion rates: This is the bread and butter of every marketing campaign.
- Customer Lifetime Value (CLTV): CLTV is important when you to impress your client with your long-term vision. This helps them understand what value the clients are bringing to their business.
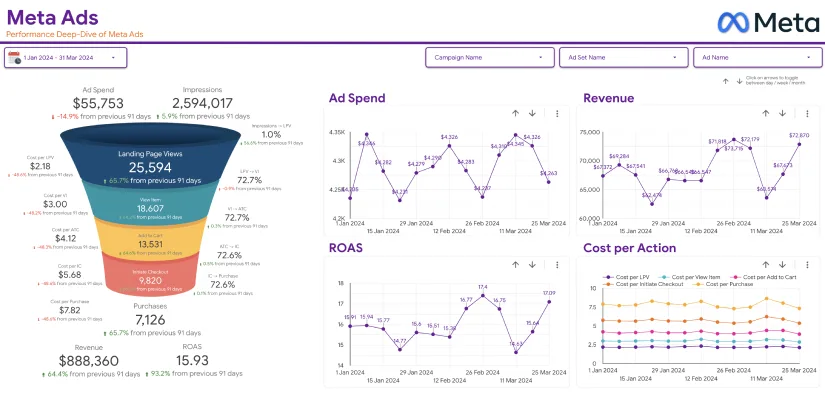
- Return on Ad Spend (ROAS): This is crucial in showing the client how much they’re getting for their buck spent on ads.
- Funnel conversion rate: This measures the efficiency of converting leads into customers. Funnel conversion rate helps your client understand the effectiveness of their marketing campaign.

How To Build Client Marketing Dashboards: Picking the Tools of the Trade
After getting your blueprint figured out, the next phase entails choosing the right tools of trade. This means picking the right platform for building your dashboard. Here, you’ll be spoilt for choice as there are plenty of options, from the classic Excel to the more sophisticated Google Data Studio, now Looker Studio.
Looker Studio
Formerly Google Data Studio, and now Looker Studio best suits the marketer looking for something fairly flexible and free. More importantly, it offers flawless integration with other products such as Google Ads and Google Analytics. This makes it easier to pull the needed data to make your dashboard alive. Plus, you can customize it as you like, so you can design marketing dashboards with a sleek modern look rather than the classic 90s.
Tableau
Tableau offers robust features with beautiful visualisations, making it appropriate for those clients ready to play in the big leagues. It isn’t the cheapest option available, but if your goal is to impress your clients with interactive dashboards with a retro vibe, Tableau is your tool of choice.
Power BI
Power BI is a powerhouse in the world of data visualization, and is perfect for those clients who live and breathe Microsoft. It’s much more user-friendly compared to Tableau and brings plenty of features and customisations that you’ll find highly useful.
Pulling in the Right Information
So, we’ve got the platform and the metrics, now the next phase of how to create a marketing dashboard is feeding some juicy data into your dashboard.
Step 3: Integrate Your Data Sources
It doesn’t matter whether you’re using Facebook Ads, Google Analytics, or your client’s CRM system, you need the right data source for this to work. Most platforms support direct integration with popular tools. However, if you’re dealing with something more niche, get ready to do some tweaks.

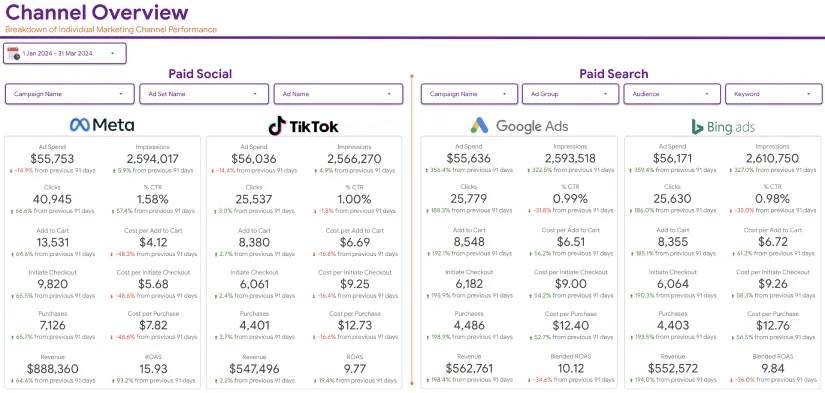
Marketing teams nowadays use numerous tools with plenty of metrics. Regardless of the number of tools used, a crucial objective of a marketing dashboard should be to consolidate the data and integrate it using a visualisation tool. A consolidated dashboard has to combine the different data sources into one source connected to the ROI and outcomes.
Step 4: Clean Up Your Data
It’s incredibly difficult to use raw data because it’s messy. So, before starting to build those graphs and charts, your data needs cleaning. This simply means dealing with outliers, missing figures, and other quirks that can turn your analysis upside down. Think of this as tidying up your house before welcoming some company over.
The Art of Visualization: Turning Data into Stories
It’s great to have data, but it won’t serve your client any good if it’s difficult to understand it. This is where data visualisation sets in. The objective of visualisation is to turn the raw numbers into a beautiful narrative that’s easy to understand and follow.
Step 5: Choose the Right Visuals
You might find that not all charts are equal. Certain metrics are best represented as bar graphs. Others are perfect as pie charts or line charts. The goal here should be to match your metrics to the right visualisation.
- Bar graphs: They’re ideal when doing category comparisons, such as sales performance across various regions.
- Line charts: Choose line charts when you need to show a trend over time, such as conversion rates or website traffic.
- Pie charts: These are great for showing proportions, such as the distribution of traffic sources. But you should use pie charts sparingly on your marketing dashboard.
Whichever visual you choose, make sure it conveys the intended message. Ensure it’s easy for your client’s marketing team to understand.

Step 6: Tell a Story
An important tip on how to build client marketing dashboards is to narrate a story, rather than just showing a collection of pretty graphs. Ensure that each chart flows into the next one, guiding the viewer through the data in a sensible manner.
To achieve this, begin with high-level KPIs as you drill down into more specific metrics. Make it feel like peeling an onion—each layer unveils something new and exciting.
Keep It Simple, Smarty
The biggest mistake that marketers make when creating a dashboard is trying to do too much. When crafting your marketing dashboard, always remember, that less is more. Displaying a dozen different metrics might overwhelm your client when as few as few can achieve the desired goal. Keep the dashboard as clean as possible and easier to navigate by sticking to the essentials. Avoid unnecessary fluff.
Step 7: Design for Clarity
Design your dashboard to be as easy to read as a children’s book. Include clear labels, use consistent colours, and always avoid clutter. If your client finds themselves searching for information or squint to see a metric, you’ve certainly missed the mark.
Step 8: Make Your Dashboard Interactive
Interactive dashboards are the new cool in the world of marketing today and for good reasons. Such dashboards let the client explore data by themselves. They can drill down into the specific areas of their interest. If the platform you’re using supports interactive features such as controls and filters, be sure to include them. This will allow the client to customise their view and see what they want to.
The Final Touch: Testing and Tweaking
Before unveiling your masterpiece, you need to do a little bit of quality control. This is crucial as it ensures whatever you’re presenting to your client actually works.

Step 9: Test your creation
Assess everything to ensure all works as it should. Check the connections to data sources, test the controls and filters, and ensure each calculation is correct. There’s nothing as embarrassing as presenting a marketing dashboard that fails with the first click.
Step 10: Collect Feedback
The last bit of how to create a marketing dashboard involves gathering feedback from your client. Do they find the dashboard useful? Is there anything that isn’t clear? Was something left out that should have been included? Tweak the dashboard accordingly to make it even more useful.
Wrapping Up
Building a useful marketing dashboard for your client is part science, part art, and much more fun if you employ the right tools and build it right. To come up with a powerful marketing dashboard, you need to focus on the right metrics that your client actually values. More importantly, use the right tools, and let your dashboard narrate a compelling story with the available data. This ensures that your dashboard is not only informative but also delightful. Are you struggling with how to build client marketing dashboards? You don’t have to stress it when you can have an expert build it for you. Eaglytics Co offers high-level digital marketing analytics based on the powerful Google Analytics platform. We build powerful dashboards to help your clients gain useful insights to drive conversion rates and positive ROI. So, go ahead and let our expert analytics services build simple, clean, dashboards that narrate your client’s story.

