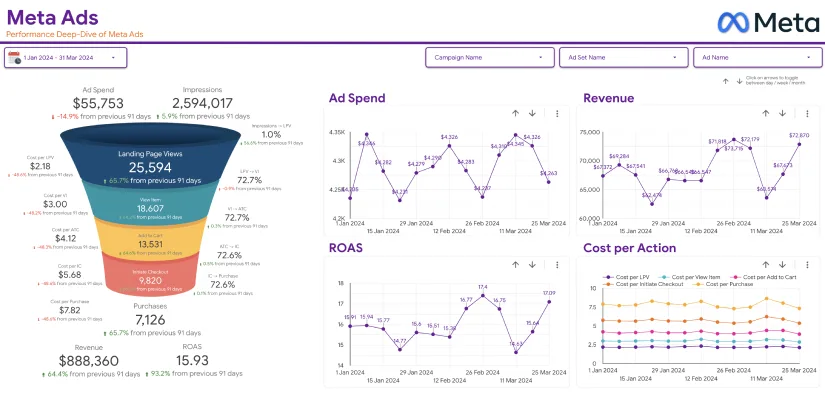
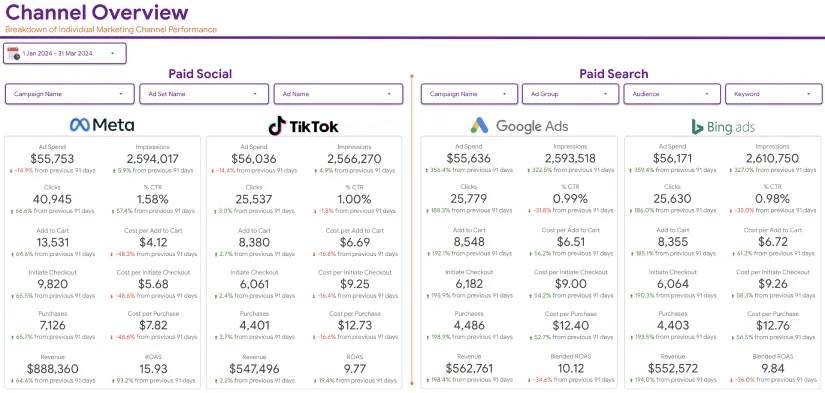
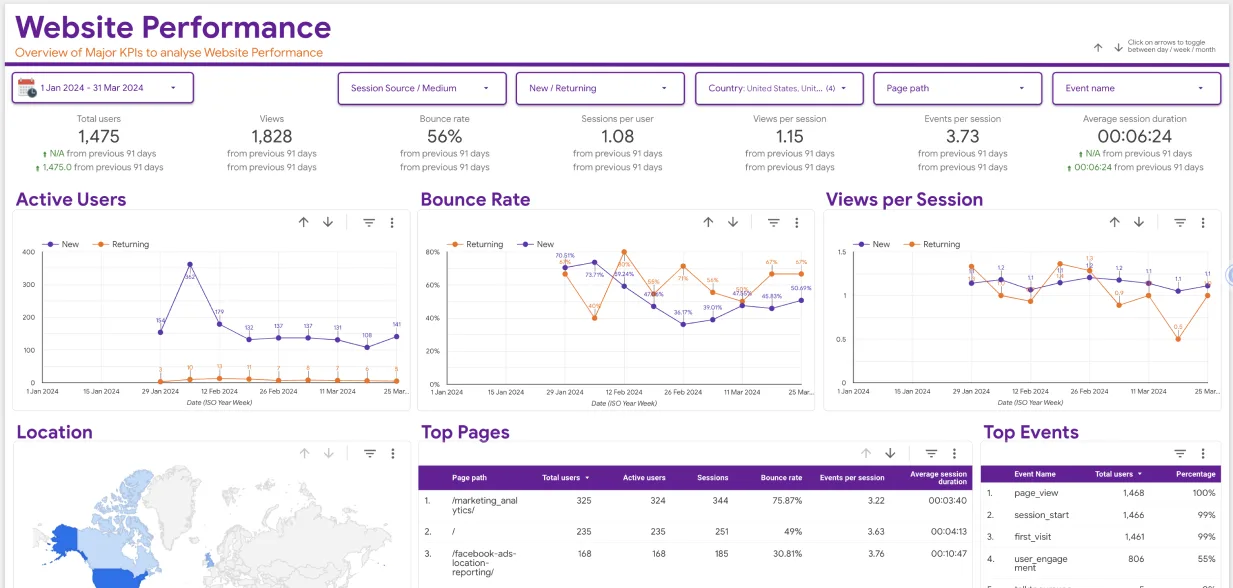
For every website owner who wants to analyze and improve their online activity, Google Analytics is a must-have tool. Its detailed interface presents a vast amount of information, which can be confusing at first. To aid you in managing such a powerful tool, we shall simplify the Google Analytics dashboard by discussing its five main components.
So if you want to learn what are the five sections of the Google Analytics Dashboard, then here is the detailed breakdown for you.
Real-time Overview
The Immediate Overview part of Google Analytics allows a user to see the movement on the current webpage at any point. This section is of great importance to these marketers as they would want to know how effective their campaigns or promotional activities have been at that particular point in time. It provides a glimpse of the engagement at the present moment and helps the user take prompt action.
Key Features
- Active Users: This parameter reveals the number of users online on your site at the moment, which helps give a live count of the visitors. This can be particularly useful during marketing launches or events and give prioritization levels to the management.
- Traffic Sources: This feature shows you how your current visitors are distributed, for instance, their sources where you have friends; some from social media, some through search engines, some simply direct. This way you understand how effective the marketing campaigns have been at that particular moment.
- Top Active Pages: This presents all the pages visited the most at any given specific time. Knowing which pages are the most popular will help implement their content more effectively, making the whole general management content strategy more effective.
The Real-Time Overview continues to assume great importance due to its ability to illustrate almost instant results of marketing activities. To illustrate, whenever a new advertisement is launched, real-time statistics indicate the active users on the website or blog shortly after the advertisement becomes active. This feature enables marketers to adjust strategies to maximize the efficiency of the campaign in an instant.
Applications

- Event Monitoring: For companies conducting live events or product unveilings, this portion enables Watching audience engagement live.
- Social Media Effect: This section shows within the Real-Time Overview how many users are clicking through to the client’s site when a social media post goes viral.
- Website Performance Verifications: If your website is experiencing problems or loading slowly, the Real-Time Overview will give insight as to what the users were doing at that critical period.
Best Practices
- Monitor During Launches: Make sure to stay focused on this segment at all times, especially during product launches or marketing campaigns, to measure users’ feedback in real-time.
- Interacting with the Users: You may want to apply chat tools or other interactive features at the times when you experience the highest traffic on your site to interact with users on your page.
2. Audience Insights
The Audience part describes the visitors to your site or service providing useful information to enhance marketing strategies. It includes factors such as age, sex, interests, location, and behaviors. With all this information, one can write content that is more fitting to the audience.
Key Features
- Audience Overview: This metric provides information on the age and gender composition of the audience, allowing businesses to know the majority of their target groups and adjust their marketing messages.
- Psychographics: This section presents the audience’s interests and preferences, shedding light on other topics and products that may engage them. For example, if the audience has a strong affinity for sports, one can easily develop content that caters to this interest.
- Location: This section discusses the location of the users, which is very important for local businesses or companies that focus on specific regions. Geographic dispersion is relevant in developing marketing positioning.
Audience Insights play a crucial role in shaping your communication and marketing strategies. To illustrate, let’s say your analytics indicate a large portion of your audience is females aged between 25 and 34; you would want to design specific campaigns that target this demographic. The less her audience understands the better her audience’s needs are met.
Applications

- Content Personalization: Understanding the interests of the audience helps in the development of more relevant content that increases engagement levels.
- Regional Campaigns: For localized businesses, geographic data can enhance comfort campaigns, ensuring that you speak to the right people at the right time and place.
- Retargeting Strategies: Audience data can also guide retargeting strategies, where exclusive visuals or advertisements are designed to address visitors based on their past engagement with the company’s web pages.
Best Practices
Classify Your Users: Leverage the segmentation tool to reach out to and gain insights about a small functional group.
Use And Conduct Surveys: Use data from Google Analytics and combine it with surveys of the users to gain a more multifaceted comprehension of the audience.
3. Channels of Acquisition
The section dedicated to Acquisition is concerned with how users come to your site. It sorts the sources of traffic into different channels and illustrates how these sources are important to the marketing endeavors. This section is significant to determine what channels are contributing the most in terms of traffic and how many conversions are being shared by those channels.
Key Features
- Channel Categorization: Inbound traffic is further divided into classes like organic, paid, social direct, and referrals among others. This categorization makes it possible to evaluate the health of each channel and decide where to spend the budget effectively.
- Tracking Advertising Campaigns: If you implement any marketing campaigns that have a time frame, this part can monitor how effective they are through UTM Parameters. You can measure the traffic and conversion rate of specific campaigns by tagging URLs with relevant information.
- Behavior of users from different sources: This feature looks at the conversion behavior of different users based on their interaction sources to the site and the respective bounce and session times. It is important to know which sources of traffic are the most active in the form of users, and which are the least interested.

Analyzing the source of traffic is crucial for enhancing your overall marketing plan. For instance, when you find that there is a specific channel that brings in high-quality traffic, you may wish to focus more efforts there. On the contrary, you could also reassess your channels if one of them is underperforming.
Applications
Optimization of Marketing Processes: Knowing the best-performing channels helps companies distribute their spending more efficiently maximizing their ROI.
Research of Campaign Effectiveness: For example, traffic driven by certain campaigns can be evaluated to improve other marketing efforts.
SEO and Content Planning: For instance, if traffic through organic search is prominent, then such information can shape content planning and search engine optimization activities.
Best Practices
Keep Turning Over Different Sources of Traffic: More often than not, look at the acquisition channels to know the improvement in the strategies.
A/B Testing: Although most channels are used to promote the messages for this kind of purpose, UTM tags are useful to assess the performance of different messages and creative strategies.
4. Behavior Flow
The behavior Flow section provides a graphical representation of the user activity on your website. This feature helps in user and exit level mapping which allows for detecting areas of strengths and possible weaknesses respectively of the site.
Key Features
- Representation of a User Path: Flow visualization represents user paths in the form of graphics. It enables you to know the most visited pages by users and the pages from which they exit your site.
- Content Categorization: This enables you to categorize content into like-kind content types and analyze the association of different types of content with user actions. You can evaluate which types of content increase user activity and lead to conversions.
- Pages From Which Users Exit: Understanding from which pages visitors are exiting can prove useful in identifying problems, if any, with content or navigation.

It is important to study the way people use your site so that you can enhance the user experience and optimize the conversion processes. When you see that people leave the website when they reach a certain point, which seems to be critical, it implies that the content or the way the users are guided through the processes needs to be improved. Fixing such problems can result in higher interaction rates and more conversions.
Applications
- Enhancing the User Experience: Assessing how users flow from one task to another can uncover bottlenecks in the user journey, and thus, improve site design and content.
- Optimizing Conversions: Businesses can modify their strategies to keep visitors who are likely to drop off at a specific point in the user journey and convert them.
- Content Strategy Development: Patterns in how users behave can assist in determining what type of content to create so that you do not create content that is not useful to anyone.
Best Practices
Enhance User Engagement on Selected High-Volume Pages: Optimize only for those pages that get the maximum traffic but have a high bounce rate to retain users.
Incorporate Internal Links: Make use of internal links to direct users to related content and help keep them on the website longer.
5. Conversions and Goals
Conversions aims to evaluate the performance of a website when meeting certain criteria. Be it making a purchase, subscribing to a newsletter, or simply filling in a contact form, you can monitor these conversions, analyze them, and thus understand the performance of your website in more detail. Now you know, what are the five sections of the Google Analytics Dashboard.
Key Features
- Tracking of Goals: These goals could include anything from logging in users, signing up new users, or even purchases. Google Analytics provides the ability to set up such goals and evaluate how well the site performs in delivering the set goals. Any processes as one including the completion of the will be regarded as conversion.
- Shopping Cart Abandonment: This analytics tool allows online merchants to view sales figures, purchase cycles, and even the flow of income. This element is very important for an online business that aims to expand.
- Multi-Channel Funnels: This functionality helps one understand the contribution of each channel over a given period and the progression of the customer journey through various channels. It also explains how people interact with the different promotional tools, thus giving an idea of the effectiveness of the campaigns employed.

It is essential to track conversions to assess the effectiveness of your marketing efforts. Knowing what drives conversions allows you to efficiently strategize on which areas to concentrate your efforts for the greatest return on investment. Furthermore, this information may assist you in optimizing landing pages, refining your language, and enhancing the user experience in general.
Applications
Assessment of Performance: Looking at the conversion rates practicing systematic measurements over time helps businesses understand how well their marketing efforts are performing and make changes if required.
A/B Testing: By observing the conversions, businesses are also able to carry out A/B tests that enable them to identify which times the content or landing pages drive better outcomes.
Mapping Moyle’s customer journey: Knowing the routes users take towards conversions and the time taken can be useful for the development of other marketing strategies and the enhancement of customer experience.
Best Practices
Establish Specific Goals: Make sure that every goal set out can be specific, measurable, attainable, realistic, and time-bound to facilitate effective monitoring of success.
Periodically Update Goals: Every so often, it is important to look back on one’s goals and modify them, depending on changes in business strategies and environments.
In Conclusion
It is well beyond the means of simply monitoring web traffic, Google Analytics is a tool that enables audience comprehension and enhances one’s digital approach. Now you know what are the five sections of the Google Analytics Dashboard. The deeper you go into each of the sections, the more sophisticated will be the evidence that can be used in developing ideas and strategies.
Last, try to keep in mind that one should always bloom and grow given how digital business and marketing concepts are ever-changing and how one’s tactics should change as well. Dig into the data and its capabilities, and allow Google Analytics to help you achieve marketing goals in the digital world.


