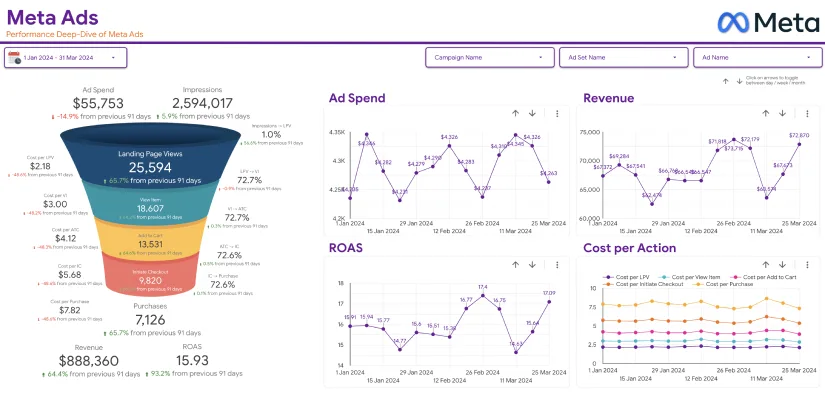
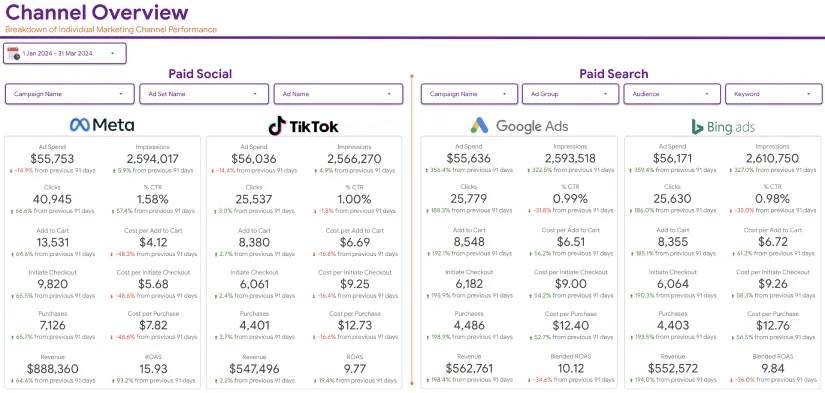
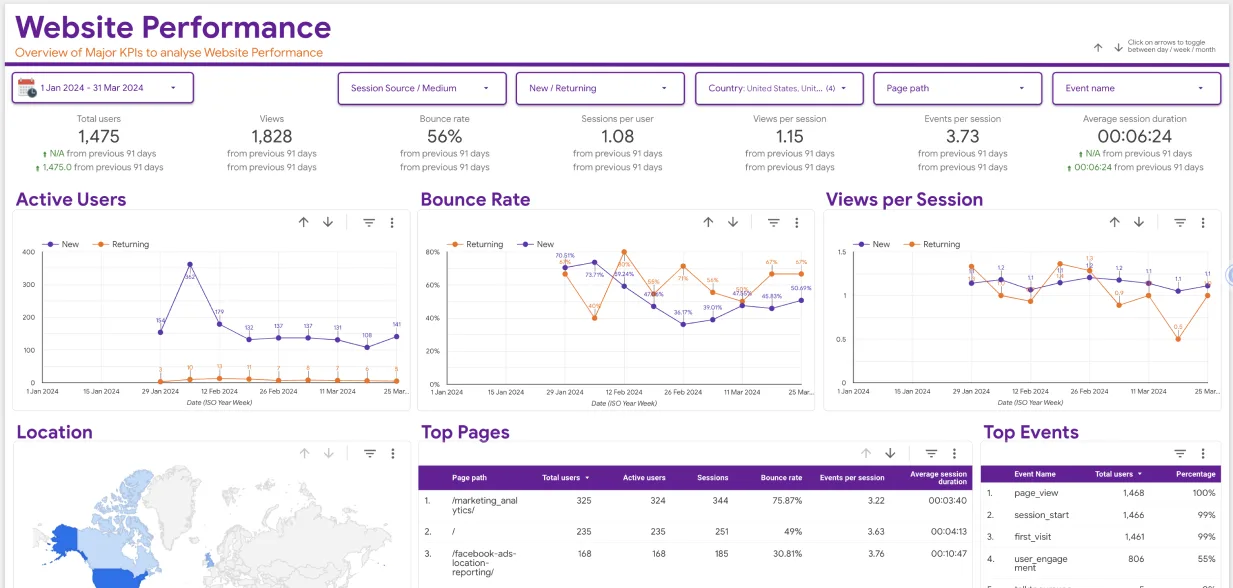
Nowadays, data isn’t just an asset—it’s a necessity. For online retailers, understanding consumer behavior, optimizing sales funnels, and improving marketing efforts depend on accurate and actionable insights. This is where E-commerce in Google Analytics becomes indispensable.
As an analytics-first digital solutions provider, we at Eaglytics Co help businesses make sense of their data. Our focus is on empowering e-commerce brands to leverage Google Analytics in a way that drives measurable outcomes. In this blog, we’ll explore the top 5 metrics you need to track to elevate your e-commerce strategy and optimize your online store’s performance.
If you’re serious about growing your business and converting visitors into customers, these are the metrics that should sit at the core of your Google Analytics Dashboard.

1. Revenue and Conversion Rate
At the heart of any e-commerce operation is the bottom line—revenue. But revenue alone doesn’t tell the whole story. Pairing revenue with conversion rate provides a clearer view of how effectively your site turns visitors into paying customers.
Why it matters:
Conversion rate is a direct reflection of your website’s ability to drive results. It shows whether your product pages, CTAs, checkout processes, and user experiences are aligned to achieve your goals.
Where to find it:
Navigate to Conversions > E-commerce > Overview in Google Analytics. Here, you can access essential metrics including:
- Revenue
- E-commerce Conversion Rate
- Transactions
Pro tip from Eaglytics Co:
Use advanced segments to break down conversion rates by traffic source, device, or geographic region. This helps identify high-performing channels and highlight areas for optimization.
2. Average Order Value (AOV)
Average Order Value (AOV) helps you understand how much revenue you’re generating per transaction. Increasing your AOV is one of the most effective ways to boost profitability without necessarily increasing traffic.
Why it matters:
A high AOV often indicates strong product bundling, effective upselling/cross-selling, or well-targeted promotions. Tracking AOV over time helps refine pricing strategies and identify opportunities for increasing per-customer spend.
How to calculate:
The Average Order Value is determined by dividing the total revenue by the total number of orders.
Where to find it:
Check it under Conversions > E-commerce > Overview in your Google Analytics Dashboard.
Our Tip:
Experiment with bundling complementary products or offering discounts on minimum order values. Track the changes in AOV to measure campaign effectiveness.
3. Cart Abandonment Rate
Shopping cart abandonment is one of the most common issues faced by e-commerce businesses. Tracking this metric can unveil significant insights into your user experience and conversion challenges.
Why it matters:
A high cart abandonment rate indicates friction in the checkout process—whether it’s shipping costs, payment methods, slow loading, or complex forms. Addressing these issues can directly impact revenue.
How to track it:
To effectively track cart abandonment, you’ll need to:
- Configure Enhanced E-commerce Tracking within Google Analytics.
- Enable Funnel Visualization in Conversions > Goals.
By comparing the number of users who added items to the cart vs. those who completed the purchase, you can calculate the abandonment rate.
Pro Insight:
We recommend using A/B testing to trial improvements like simplified checkout, guest login, or free shipping thresholds—and monitor the impact using your dashboard.
4. Customer Lifetime Value (CLV)
Customer Lifetime Value (CLV) measures the total worth of a customer over the duration of their relationship with your brand. While this metric can’t be calculated directly through default Google Analytics, integrating GA with CRM or using Google Analytics 4 (GA4) allows for more accurate LTV modeling.
Why it matters:
A higher CLV means your acquisition and retention strategies are working. It also helps in budget allocation—for example, how much you should spend to acquire a customer based on projected revenue from that customer.
How to track:
In GA4, go to Analysis Hub > User Lifetime to view lifetime metrics like revenue per user.
What we suggest:
Track CLV by source/medium to understand which acquisition channels bring the most valuable customers. It’s also useful for tailoring loyalty programs and retention emails.
5. Product Performance Metrics
Not all products contribute equally to your revenue. With E-commerce in Google Analytics, you can break down sales performance by product, category, or SKU. This gives you deep insights into what’s hot and what’s not.
Key metrics to track:
- Product Revenue
- Quantity Sold
- Buy-to-Detail Rate (number of purchases / number of product detail views)
- Cart-to-Detail Rate (number of times added to cart / number of product detail views)
Where to find it:
Under Conversions > E-commerce > Product Performance.
Why it matters:
These insights help guide inventory management, pricing strategies, marketing efforts, and even product development. For example, a product with high views but low conversions might need better images, descriptions, or a price adjustment.
Bonus Metric: Traffic Source Performance
While not strictly a part of the e-commerce section, understanding which traffic sources drive sales is essential for ROI measurement.
Head to Acquisition > All Traffic > Source/Medium and apply e-commerce segments to see how each channel performs in terms of transactions and revenue. This helps in fine-tuning ad spend and content strategies.
Why E-commerce in Google Analytics is a Game Changer
Tracking these metrics allows you to go beyond guesswork. Whether you’re a startup or a scaling brand, data-driven strategies will always outperform intuition.
At Eaglytics Co, we provide tailored solutions that make your Google Analytics Dashboard an asset, not just a tool. Here’s how we support e-commerce businesses:
- We implement Enhanced E-commerce Tracking with precision.
- We create custom dashboards that consolidate key KPIs for daily monitoring.
- We help interpret data to make informed decisions that lead to growth.
Let Your Data Tell the Story
E-commerce success isn’t just about flashy products or aggressive marketing—it’s about understanding what your customers want, how they behave, and where you can optimize. And that insight lies within E-commerce in Google Analytics.
If your current setup only scratches the surface, you’re leaving valuable data—and money—on the table. By focusing on these top five metrics and using a well-structured Google Analytics Dashboard, you create a feedback loop that enables ongoing optimization and business growth.
Final Thoughts
Data without context is just noise. But when you focus on the right metrics, organize them effectively, and interpret them wisely, you gain a significant edge in a competitive e-commerce landscape.At Eaglytics Co, we believe that every e-commerce brand deserves access to insights that drive measurable results. We don’t just set up dashboards—we create digital strategies that grow with you.


