In today’s data-driven world, businesses rely heavily on analytical tools to extract valuable insights. But gathering data is only half the battle; knowing how to interpret it effectively is what truly drives success. Without proper analysis, even the most sophisticated analytical tools can lead to misguided decisions. This blog will guide you through the process of interpreting data insights, ensuring that you make informed and strategic business choices.
Understanding Analytical Tools
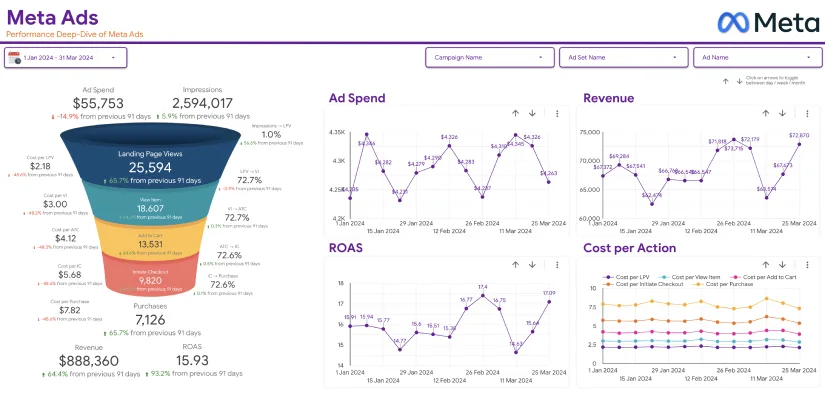
Before diving into data interpretation, it’s essential to answer a fundamental question: What are analytical tools? Analytical tools are software or platforms used to collect, process, and visualize data. They help businesses analyze trends, measure performance, and identify patterns that drive decision-making. Some common analytical tools include Google Analytics, Microsoft Power BI, Tableau, and IBM Watson Analytics.
These tools can analyze various types of data, such as customer behavior, sales performance, website traffic, and operational efficiency. However, the real challenge lies in extracting actionable insights from the numbers and graphs they present.

The Importance of Data Interpretation
Raw data, without context or interpretation, is just a collection of numbers. Effective data interpretation helps businesses:
- Identify opportunities for growth
- Understand customer behavior and preferences
- Improve operational efficiency
- Optimize marketing campaigns
- Mitigate risks
By mastering data interpretation, you can turn raw figures into meaningful insights that drive decision-making and boost business performance.
Steps to Interpreting Data Insights Effectively
1. Define Your Business Goals
Before analyzing any data, you must clearly define your objectives. Are you trying to increase sales? Improve customer retention? Reduce costs? Having a well-defined goal will help you focus on the most relevant data points.
For example, if your goal is to enhance customer engagement, you should pay attention to metrics like website traffic, bounce rates, and user interactions rather than just overall revenue.
2. Understand the Data Metrics and KPIs
Every analytical tool provides various metrics, but not all of them are relevant to your business goals. Some key performance indicators (KPIs) include:
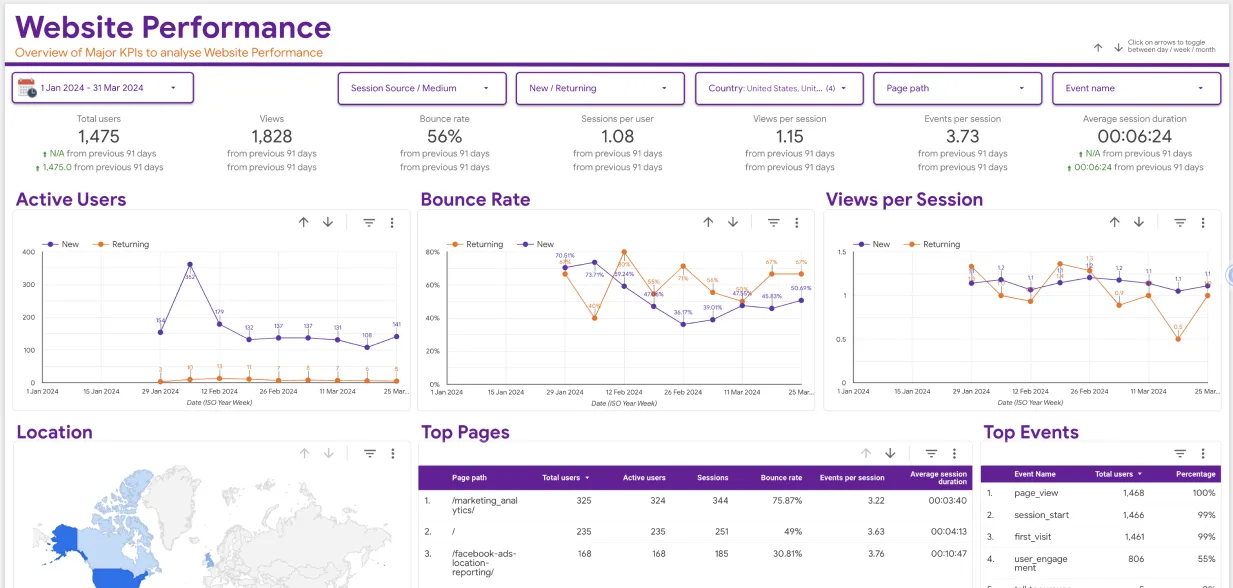
- Website Metrics: Page views, bounce rate, conversion rate
- Marketing Metrics: Click-through rate (CTR), cost per acquisition (CPA), return on investment (ROI)
- Sales Metrics: Revenue growth, customer lifetime value (CLV), churn rate
Knowing which KPIs matter most will help you avoid information overload and focus on the most impactful data.
3. Look for Trends and Patterns
One of the most effective ways to interpret data is to identify trends and patterns over time. For instance:
- If your website traffic has been steadily increasing but conversions remain low, it may indicate a problem with user experience or call-to-action buttons.
- A sudden drop in sales could signal seasonal fluctuations or a competitor’s new strategy.
- Analyzing customer buying habits over different time periods can help forecast future demand.
Most analytical tools offer visualization features such as graphs and heatmaps to make trend identification easier.
4. Compare Against Benchmarks
Interpreting data in isolation can lead to misleading conclusions. Always compare your insights against industry benchmarks or historical data to gain meaningful context.
For example:
- A 2% email marketing conversion rate may seem low until you compare it with the industry average of 1.5%.
- A high bounce rate of 60% might be concerning for an eCommerce store but normal for a blog site.
By benchmarking your data, you gain a clearer perspective on whether your business is underperforming or excelling.
5. Identify Anomalies and Outliers
Sometimes, data contains unexpected spikes or drops. These anomalies could indicate:
- A successful marketing campaign that led to a surge in traffic
- A technical issue causing incorrect data tracking
- A major industry event influencing customer behavior
It’s important to investigate anomalies rather than assume they are errors. Understanding the reasons behind sudden changes can provide valuable business insights.
6. Use Segmentation for Deeper Insights
Segmenting data allows you to uncover hidden trends within specific groups. Most analytical tools offer segmentation features, enabling you to analyze data by:
- Demographics: Age, gender, location
- Behavior: New vs. returning customers, purchase history
- Channels: Organic traffic, paid ads, social media referrals
For instance, if your website conversion rate is 3%, segmenting by traffic source might reveal that organic traffic converts at 5% while paid traffic converts at only 1%. This insight helps refine your advertising strategy.
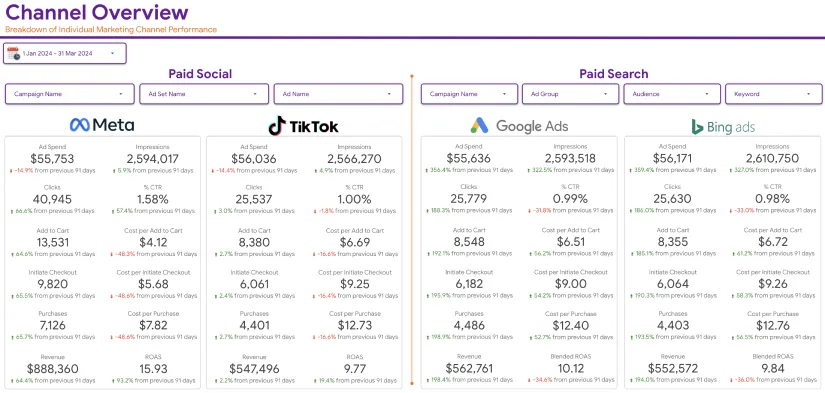
7. Correlate Data Across Multiple Sources
Relying on a single data source can lead to biased interpretations. Cross-checking data from multiple sources ensures accuracy and provides a holistic view.
For example:
- If Google Analytics shows a drop in website traffic, compare it with your social media engagement to see if a decline in social promotions is the cause.
- If customer complaints increase, check your product return rates and online reviews to identify patterns.
Integrating data from various analytical tools creates a more comprehensive understanding of business performance.
8. Apply Predictive Analysis
Modern analytical tools use artificial intelligence (AI) and machine learning to predict future trends. Predictive analytics helps businesses:
- Forecast sales trends
- Identify potential customer churn
- Optimize inventory levels
Using these advanced insights, businesses can take proactive measures rather than react to problems after they occur.
9. Translate Data into Actionable Strategies
Interpreting data is only valuable if it leads to action. Once you’ve extracted meaningful insights, create an action plan to address challenges or leverage opportunities.
For instance:
- If data shows that mobile users have a higher bounce rate, optimize your website for mobile responsiveness.
- If customer engagement on social media is declining, experiment with new content formats or posting schedules.
Making data-driven decisions ensures that your strategies are backed by solid evidence rather than guesswork.

10. Continuously Monitor and Optimize
Data interpretation is an ongoing process. Regularly reviewing your analytics ensures you stay ahead of trends and adapt to changes. Most businesses use dashboard tools to track performance in real-time and make adjustments accordingly.
Conclusion
Interpreting data insights effectively is the key to making informed business decisions. By understanding what analytical tools are, identifying trends, benchmarking performance, and correlating data from multiple sources, businesses can transform raw data into strategic action plans.
At Eaglytics, we help businesses harness the power of analytics to drive growth and efficiency. Whether you’re looking to improve customer engagement, optimize marketing strategies, or enhance operational performance, mastering data interpretation is your pathway to success.
Start leveraging your analytical tools today and unlock the full potential of your business data!