If we are going to talk about data analytics, 2022 is the year for that. Today we are going to talk about Google Data Studio Vs. BigQuery. We hope this article will be precious for you. You might be a newcomer or a pro when it comes to data analytics. Either way, you surely know about these two tools.
Even though we called these platforms tools, we cannot recognize both Google Data Studio Vs. BigQuery as tools. Don’t get confused; we meant one is a BI tool, and the other is a BI engine. We will talk about which is which later in the article. But we are planning to do this in a proper way. Therefore, first, here is an introduction to data analytics.
What is Data Analytic?
Data analytics is a process that uses for analyzing raw data and delivering a final product capable of giving conclusive information. This data analytics process uses an automated mechanical and algorithm process to convert raw data into valuable information. For a business, it can use data analytics to optimize its business performance.
For instance, a manufacturing company can use data analytics to its advantage. First, they will record downtime, runtime, and work queue of various machines. Then analyses those raw data to improve the performance of their machines. During this process, data analytics check for duplication and errors before submitting the final information.
Why You Need Tools like Google Data Studio and BigQuery
Now, we hope that you have a better understanding of data analytics. But why do we need tools like Google Data Studio and BigQuery?
For instance, most businesses and organizations can easily analyze small data sets. But, when it comes to a large amount of data, they will need advanced data analytics tools. In a situation like that, data analytics and its tools come in handy. Therefore, when we deal with a large amount of data, using tools like Google Data Studio and BigQuery can make a huge difference. Later in the article, we will discuss about the uses of these tools. Before we do that, understanding the Google Data Studio Vs. BigQuery is crucial. So, let’s get started.
Google Data Studio

Google Data Studio is one of the best data visualization tools that allow you to create interactive dashboards and customized reporting. Most of the Google Data Studio features are simple and completely free to use. Also, you can share and schedule reports with minimum ease.
Besides, as we mentioned earlier in the article, Google Data Studio is a BI tool. BI means Business Intelligence. You can use this BI tool to determine key performance indicators for your business. Then you will be able to compare the performance over time.
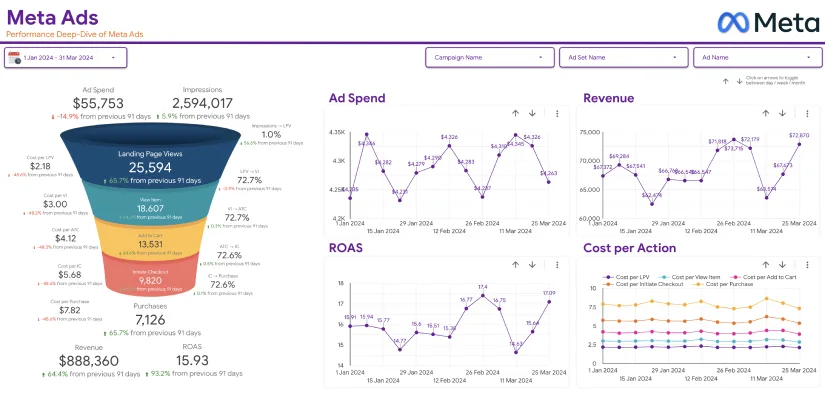
In other words, Google Data Studio is a much more improved version of the Google Analytics dashboard. For instance, the Data Studio dashboard is more visually rich than the Google Analytics dashboard. In Analytics Dashboard, you will be able to see more numbers as its information. On the other hand, Data Studio presents more detailed graphs and charts. One of the best examples is that the Data Studio will display the clicks and impressions via chart. So, it is a more visually appealing method than plain old text.
How to Use Google Data Studio?
Google Data Studio is a free BI tool. To use Data Studio, you will need a Google account. No installation is required, and it is a straightforward process. However, for the sake of the article, we will cover about how to use Data Studio. So, if you are a newbie, you will find the following section very important.
Step 1: First, go to the datastudio.google.com.
Step 2: Use your Google Account to sign in to your Data Studio account.
Note: There should be several tabs on the Data Studio homepage (after the login). But, as a beginner, first, you must get familiar with your surroundings before diving into the advanced stuff. So, in this next step, we will teach you how to get started.
Step 3: Now go to the Reports tab. In there, you can find three report types. Black Report, Tutorial Report, and Acme Marketing. We recommend going through the Tutorial Report first. By doing that, you will get a basic idea of how the Google Data Studio works.
Main Features of Google Data Studio

There are multiple features available on the Google Data Studio. However, we picked the best features that stand out from the others.
Live Data Connection
With over 400 sources, Google Data Studio built-in connections support native connections like Google Analytics, Google Sheets, Google Ads, Cloud Storage, BigQuery, and many more. When it comes to Outside Data sources, it supports Adobe Analytics, Facebook, JASON, and more. Because of these sources, there won’t be any need to schedule periodic refreshes of the data.
Also, having live data sources back up can help your operations immensely. For instance, if you have a proper backup process, you can examine the results of the date range.
Besides, with Google Data Studio blending ability, you can merge up to 4 data sources effortlessly. You will be able to use this feature while creating reports. For instance, when using Data Studio, you will be able to blend data from Google Analytics, Google Sheets, Facebook, and JASON.
Tip: Google Data Studio is capable of dealing with both SQL and NoSQL data sources.
Full Customization Controls
When it comes to customization, Google Data Studio has no limitations. You will be able to add and customize pages, tables, and charts pretty easily. For instance, you will be able to customize the dashboard according to your company colors or client colors. Here are some of the popular customizations that Data Studio offers.
- You can create custom themes according to preferences. Or select the pre-filled theme. Another cool thing about Google Data Studio is that you can extract themes from images. This gives the user more creative customization options.
- You can change the page size and alignment according to your needs.
- Google Data Studio comes with various charts and visuals. So, it is genuinely a good visualization tool. For instance, you will be able to use bar charts, line charts, and more. Or you can go one step further by using Googles Maps visuals.
- Allows you to use conditional formatting. For instance, if you need a highlight the results of Organic Sessions that are below your intended goal, with the conditional formatting, you can accomplish it pretty easily.
Dynamic Controls

Dynamic controls are one of the reasons most people love Google Data Studio. It allows users to slice and dice data without updating the report. Here are some more benefits of dynamic controls.
- You can filter out their content with date and dimension range.
- You can include or exclude content according to your needs by filtering them.
Drill Up and Drill Down Options
With Drill Up and Drill Down options, you will be able to sort the data according to high levels and low levels. In other words, you can arrange the list in ascending and descending order.
Optional Metrics
Optional Metrics give you an additional layer of control. You can customize any data set without editing the original report. And, here is how to activate Optional Metrics. First, select the chart. Then go to the properties panel located under Metrics. Finally, turn on the Optional Metrics. Now you will be able to access the Optional Metrics by hovering over the chart. This feature gives its users various types of metrics.
Custom Bookmark
With the Custom Bookmark feature, the user will be able to bookmark the desired links. It is a valuable feature that allows users to go back to previous reports quickly.
Advanced Formulas
Inside Google Data Studio, there are plenty of advanced formulas available. These formulas allow users to create a powerful visualization.
Calculated Fields
A calculated field allows you to create new dimensions or metrics from the existing data. Therefore, you will be able to perform calculations, transform the data or develop categories easily.
One of the more advanced uses of calculated fields is CASE statements. With the help of CASE statements, you can return metrics and dimensions according to the conditional expressions. It is commonly used to create new groups and categories of data.
Pricing

As we already mentioned, Google Data Studio is a Freemium Business Intelligence tool. Even though compared to other tools, Data Studio needs much improvement. You will get a clear idea when we discuss about BigQuery while comparing the Google Data Studio Vs. BigQuery. But you won’t get all these features for free anywhere else.
What Need to Be Improve?
Even though Google Data Studio is a great BI tool that can help Individuals, Large Enterprises, Freelancers, Small businesses, and Medium businesses, there are some improvements that can be made. So, in this section, we will talk about those improvements.
Much Better Formatting: It is a well-known fact that Google Data Studio has unique formatting. But, when compared to other google applications like Google Sheets, it is not the same. Sometimes you might encounter some data issues that are related to formatting. For instance, it won’t work properly if you don’t format the data accordingly.
Not the Perfect BI Tool: even though Google Data Studio is a good BI tool, compared to other high-end BI tools, Data Studio lacks many things. For instance, it does not have advanced analytics features. So, improvement on that department is needed.
Data Blending Feature Needs Improvement: When it comes to data blending, Google Data Studio can blend up to 4 data sources. But this data blending feature is in the early stages. There are lots of improvements to be made in that department too.
BigQuery
Big Query is a fully managed BI Engine that comes with a serverless data warehouse. With this BI engine, you will be able to get high concurrency and sub-second response time. Besides, BigQuery can be integrated with the Google Data Studio. We will look at that later in the article. Also, BigQuery works fine with the other BI tools such as Looker, Power BI, and Tableau.
Furthermore, BigQuery has machine learning capabilities. Suppose we are comparing Google Data Studio Vs. BigQuery, MLis one of the most significant differences that BigQuery has.
BigQuery is capable of capturing and analyzing data set in real-time using streaming injection abilities. So, your business insights are always up to date and its free up to one terra byte of data.
How to Use BigQuery?
In this section, you will learn how to use Google BigQuery. This is a simple explanation of how to create an account and how to use BigQuery. We will get into advanced stuff later in the article.
Step 1: First, go to cloud.google.com. This is the Google cloud platforms website. Here you will find a lot of tools. But, for this tutorial, go to the BigQuery webpage.
Step 2: To use Bigquery, you will need a Google Cloud account. So, create a Google Cloud account. It’s completely free. But you will have to provide your credit card information. If you like, you can always upgrade. But, for now, we will stick with the free version.
Step 3: After creating a Google Cloud Platform account, find to BigQuery and select it.
Step 4: Now, you can create your first data analysis. To do that, first prepare your data using a CSV file. Then click the Create dataset button. Next, name the data set click on the create dataset button.
Step 5: Then, select the data set and click on Create Tables button. In Create Tables window, choose the option to upload the data file and upload the previously prepared CSV file. Also, turn on the Schema feature. Schema is capable of recognizing string, float, and numbers correctly. After that, click the Create Table button. Now your first data set is ready; it will display below the Unsaved query section. With basic SQL knowledge, you can run various types of analysis. Whatever the operations, the results will be shown in sub-seconds.
Main Features of BigQuery
Now you are ready to discuss the most crucial part of the Google Data Studio Vs. BigQuery comparison. In this section, we will talk about key features of the BigQuery BI engine.
Serverless Services
Most data warehousing environment needs specific server hardware to perform their calculation. Therefore, this type of platform determines the server hardware before beginning the calculations. And then, administrators need to ensure reliability, performance, security, and resilience. These two operations are crucial for most warehousing operations. But, when you use BigQuery, you can stretch these limitations easily.

Mainly, because BigQuery is a server-less platform, you don’t need to initiate the above-mentioned operations. This is one of the best features of the BigQuery BI engine. In this serverless model, the entire process is distributed automatically among many parallel machines.
Various Programming Language Supported
When using BigQuery, you will be able to access various programming languages. Also, good knowledge of SQL will come in handy while doing data analytics using BigQuery. In addition, the Google BigQuery Bi engine uses programming languages like Python, Java, C#, PHP, Ruby, Node.js, and Go.
Tree Architecture
BigQuery can extend its calculation to thousands of computers that act as an execution tree. Therefore, any calculation can be completed within sub-seconds. Here is a simple explanation for that process.
First, the root server gets the incoming requests. Then the root server forwards those requests to a branch. This branch is called a mixer. After that, the branches modify the received request and send it to the leaf node, aka slot. The leaf node initiates the filter and reading process of the data using parallel. Then return it to the bottom of the tree. Finally, the mixer catches that data and sends it to the Query.
This is the process of tree architecture. It is a little complicated process for beginners to understand. However, make sure to go through the process again if you have difficulties understanding.
Machine Learning (ML)
Even though very few businesses adopt Machine Learning, there are plenty of benefits of ML. When Machine Learning comes with BigQuery, those benefits are stretched to another level.
Machine Learning allows companies to democratize data science capabilities more than ever. For instance, BigQuery ML can utilize the running models over real-time data queries.
For those businesses that try to accelerate their data analytics and ML journey, BigQuery ML is the perfect tool.
Multiple Data Types

BigQuery supports multiple data types. For instance, it supports strings, Boolean values, numbers, structs, and arrays. Therefore, any operation can be done smoothly using BigQuery.
Security
When it comes to security, Google’s BigQuery is one of the best analytics tools available in the market. Besides, whenever you transfer or store data, BigQuery automatically encrypts those data. Also, BigQuery can isolate jobs. It can manage the security of a multi-tenant activity. Furthermore, Google BigQuery integrates with other GCP products’ security features to give a complete picture of the security. Therefore, data security is at the highest level when it comes to BigQuery.
Pricing
In BigQuery, you need to pay as you go. That means there is no fixed price for a month. You will be charged according to your usage. There are two parts to this pricing format. You have to pay for both of these parts differently.
- Storage
- Queries
Storage
When it comes to storage, there are two pricing models.
Active: The data modified or edited during the last 90 days
Active storage will cost you $0.02 per 1GB. This is the cost per month. therefore, if you store 100GB of data per month,
100 × 0.02 = $2
Long-term: The data that has not been modified or edited during the last 90 days
For Long-term storage, you will have to pay $0.01 per 1GB. Therefore, if you store 100GB per 90 days,
100 × 0.01 × 3 = $3
As you can see, it will cost you $3 to store 100GB for 90 days, and it is less expensive than Active storage. However, if you modify those data during the 90-day period, the process will return back to zero.
Queries
When it comes to queries, there are two types of pricing models.
On-Demand: $1.1 per 1TB data read for one month
Flat Rate: Depending on the requirements, you can purchase slots.
What Need to Be Improve?

Overall, Google BigQuery is a well-balanced BI engine. You already know that if you follow the comparison of Google Data Studio Vs. BigQuery. However, there are specific areas that need to be improved. So, let’s check them out.
UI UX Features
Even though BigQuery comes with quality UI UX features, it can be improved more, especially when it comes to the navigation inside the folders.
Small Data Sets
For big data sets, BigQuery is one of the best options in the market. But, when it comes to the small data sets, the initialization time takes 3 or 4 seconds. This is a major disadvantage when competing with other data warehouses. So, definitely needs to improve in that department.
Pricing Models
Even though BigQuery has several pricing models, some people might take time to get used to these pricing models. These pricing models are less expensive compared to other BI engines. But the whole pricing models system might confuse some people. Therefore, it needs much more simplicity. The issue is most people back away when money-related things get complicated. So, having an easy-to-understand pricing system will benefit BigQuery greatly.
How to Visualize BigQuery Data Connector Via Google Data Studio?
We hope our explanation of Google Data Studio Vs. BigQuery is able to shed some light on your data analytics journey. If you follow the article carefully, now you might have a good idea about these two platforms. However, in this section, we hope to go through how to use BigQuery Data Connector and Google Data Studio to visualize a data set.
In other words, we are going to create a report using the BigQuery data source. So, without wasting much time, let’s get started.
Step 1: Go to the official Google Data Studio website and log in to your account.
Step 2: Then go to the Reports tab and select Blank Report template.
Step 3: you might have to complete the Account and Privacy and Marketing Preferences settings. If that is the case, provide the relevant information and click Save. Now again, open the Blank Report Template.

Step 4: Go to the Add data to report tab. Now type BigQuery in the search box.
Step 5: In the Google Connectors list, find the BigQuery and click it.
Step 6: After Step 5, you need to give Google Cloud project authorization to Google Data Studio. So, click the Authorize button.
Step 7: Now, the process will ask permission to access BigQuery data source. So, a dialog box will pop up labeled as Request for permission. Click Allow button to give Google Data Studio the permission to BigQuery data.
Note: You might not get this dialog box if you have already used Google Data Studio.
Step 8: Select Public Datasets under My Projects.
Step 9: Now select the name of your Cloud project under Billing Projects.
Step 10: Select samples under Public Dataset.
Step 11: Finally, select natality under Table.
Step 12: Now click on the Add button. After that, Google Data Studio will connect with BigQuery data source. All the tables will be displayed. On this page, you can create calculated fields. Also, you will be able to adjust field properties.
Step 13: By using the natality table, you can view all the integers fields corresponding to your data set. You can change any field value easily.
Step 14: After all the editing is done, click Add to Report button. If needed, allow permission for Google Data Studio to view and edit files in Google Drive.
Which one is Better Google Data Studio Vs. BigQuery?
We hope that, with our comparison of Google Data Studio Vs. BigQuery, you were able to enhance your knowledge when it comes to data analytics. But which platform is the best?
Unfortunately, we cannot pick a winner among these two platforms. Because Google Data Studio is a BI tool and BigQuery is a BI engine. So, there is no doubt the BI engine is more powerful than the BI tool. However, Google Data Studio has some excellent features that can accomplish great things for your business. And it is entirely free. On the other hand, BigQuery is capable of Machine Learning, and most importantly, it is a server-less service. So, picking a winner is not just impossible; it is unfair too.
All things considered, we can say if you are planning to start a career as a data analyst, both of the platforms are an excellent addition to your journey. They both are very popular, and in the coming years, we could see more development in these platforms. So, it won’t kill you to stay in touch with these two unique platforms.