Klaviyo reporting is a powerful tool that allows you to get the answers you need to make strategic decisions about your business.
Every business wants to see growth. And in order to track and understand what’s working well and what could be improved, you need accurate reporting metrics. As a marketer, this may be the most important information you receive on a day-to-day basis: Where is your traffic coming from? What channels perform best for each stage of the funnel? Where are your customers falling off?
Custom reports are the best way to get this information, but they can be incredibly time-consuming. Fortunately, we have some really useful built-in Klaviyo reporting templates, so you don’t have to build every custom template from scratch. And if you’re working with large amounts of data on a daily basis, our data API makes it easy to extract the data you want on your own.
To get started on your custom reporting journey, read this guide for tips and resources to help you build a comprehensive Klaviyo reporting strategy that will grow with your business over time.
Creating a Custom Report:
If you are new to custom reporting, then you will find Custom Reports in the Analytics tab.

The Klaviyo dashboard allows you to select an existing report or create a new one to analyze.
When you choose ‘Create from scrath,’ you’ll be directed to a new report page where you will have five different report types to choose from.

These report types are:
- Single Metric Report
- Multi-Metric Report
- Campaign Report
- Flow Report
- Product Report
Additionally, you can choose your timeframe according to what you want from your analytics.
Now the question is how to use these five key reports to get the answers you need. Before diving into analyzing, you should start with a strategy.
How to Build a Custom Report Strategy?
Learn how to create a custom report strategy tailored to your needs. This section covers defining objectives, selecting key metrics, and organizing data for impactful, informed decision-making.
Step 1: Know your questions.
It is important to know what you want from this analysis and what questions you want answers to. For example:
– How much traffic is coming from each marketing channel?
– What are my best-selling products?
– Which Klaviyo email reporting gets the highest engagement and conversation rates?
– Where are you gaining and losing most customers?
Once you’ve identified what reporting data your team needs to build reports that will answer these questions (and more), you can get started.
Step 2: Choose the report type to create.
You can customize each of these five report types further to help answer your query.
Single Metric Report:
This report type will help you answer specific questions, such as: How is one metric changing week-over-week? or month-over-month. This is especially useful in tracking down how one product is performing over time.
Multi-Metric Report:
If your question requires multiple metrics and dimensions, then this report type is most helpful. For example: How does my list size grow or reduce overtime in a single channel? Or How did your company perform in the previous year month by month?
Campaign Report:
Use this report type if you want to have a direct understanding of how a particular campaign performed. For example, How well did this campaign perform? And you can add multiple tags in this kind of report type where if one customer does not match all the given filters, they would not be included in the list.
Flow Report:

This report type is perfect for getting an in-depth look at user behavior at specific points in your workflow. Understand the flow performance across your key metrics at a granular level in Klaviyo reporting.
Product Report:
For detailed insights into how your products are performing, use this report type. This will help with understanding which product is being sold the most, how another product is performing?
Step 3: Take action based on your analysis
Your Klaviyo reporting API represents data, not a solution. Consider it as a hypothesis that needs to be checked with your audience.
You will need to take action based on the insights you gain from custom reporting.
For example, if you find out which email campaign performs best, you can send a follow-up email to those customers on the ’email list.’
If you want to improve your customer lifetime value, go back and look at how much revenue was generated from each channel or product. Then try to put together a new strategy that will boost your returns.
How will you benefit from integrating Klaviyo with Google Data Studio?
When working on custom Klaviyo reporting with a huge amount of data, building reports can take days.
With Klaviyo, you’d be able to build your own personalized reporting strategies that are specific to your business goals.
And with integrating it to Google Data Studio, reporting becomes easier and faster.
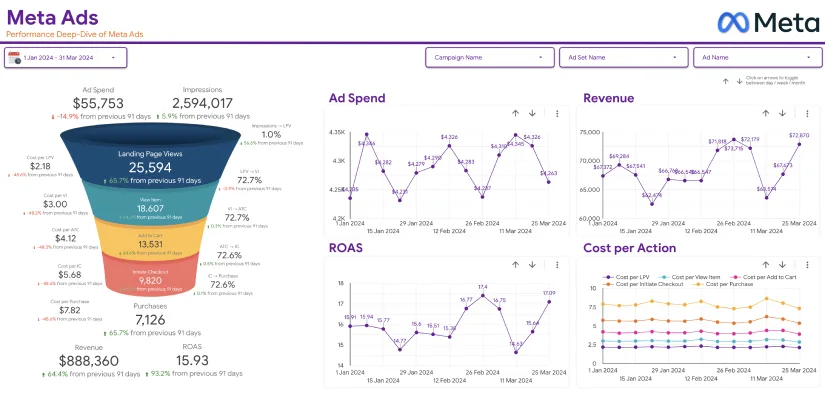
Google Data Studio is a free add-on that makes it easy to create reports and Klaviyo dashboards with your Klaviyo data. You can use the custom reporting capabilities in Data studio to build rich visuals and gain deeper insights into your business based on specific datasets you’re working with: like data from your eCommerce store or list growth to Klaviyo’s email reporting metrics.
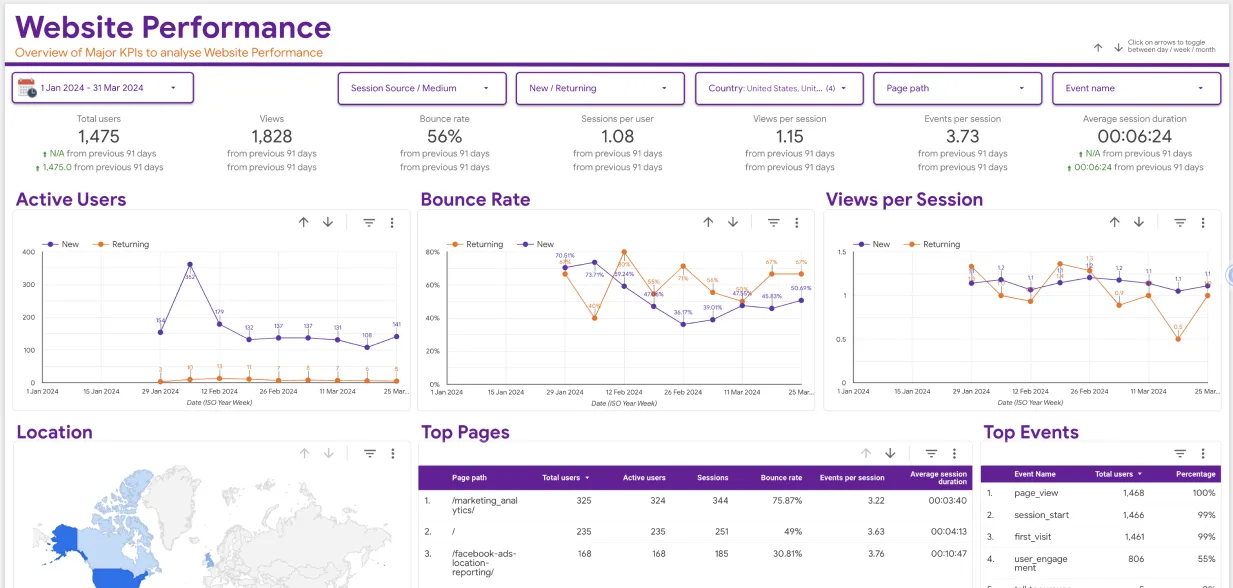
– You can create Klaviyo dashboards or reports containing any of the predefined Klaviyo reporting types. Select your charts, tables, matrices, etc., from Data Studio’s library of objects and arrange them with just a few clicks.
– You’ll also have access to date filters, selectors, time series charts, and other visualizations in addition to Klaviyo report types.
– Share your reports with anyone. Your team, clients, or even investors can access the same dashboards and insights without any complicated integration.

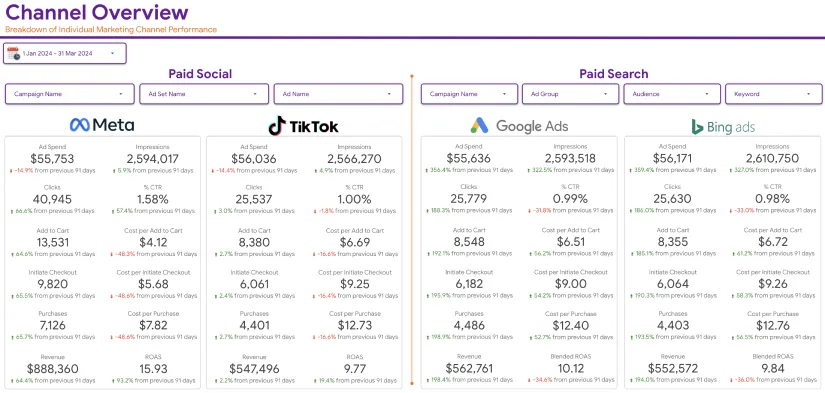
You will be able to see all your reporting in one place without the need to switch between spreadsheets. Your Klaviyo data and reporting can now sit within easy reach alongside Google Analytics and AdWords, among other sources.
Klaviyo’s Data Studio integration bridges the gap between marketing and analytics, so you’ll be able to see how your marketing strategies are performing in one centralized location.
Google Data Studio is designed for users who want to customize their reporting and data visualizations using Klaviyo data but do not require custom programming or development capabilities.
Conclusion:
Custom reporting can be tough, but after reading this guide on building a custom report type by yourself using Klaviyo, you can now make your own unique strategy.
For example, if you want to learn who performed best in an email campaign or how well your products are doing, you can do it all with Klaviyo.
Unlike custom reports the marketing performance dashboard in Klaviyo has great built-in tools to look for your marketing performance; read our blog to know more. If you have any questions about evaluating your data, don’t hesitate to reach out to us!