The Klaviyo dashboard is a powerful tool that allows marketers to see both the big and small picture in real-time. The Klaviyo dashboard provides a great visualization of the campaign and flows performance, which is ideal for marketers who want to quickly monitor their campaigns’ effectiveness. In this blog post let’s understand the marketing performance dashboard in Klaviyo.
How to use Klaviyo Dashboard:
Once you have started sending your campaigns and have flows in your account, the Klaviyo dashboard will automatically populate with traffic and email information. Let’s take a look at how to navigate to the Klaviyo dashboard and what some of these key Klaviyo metrics mean.
To start, log into your Klaviyo account and click on ‘Dashboards’ at the top of the page, where you are presented with 5 different tabs to navigate through; those 5 are as follows:
- Objectives
- Performance
- Analytics
- Lists and Segments
- Activity Feed
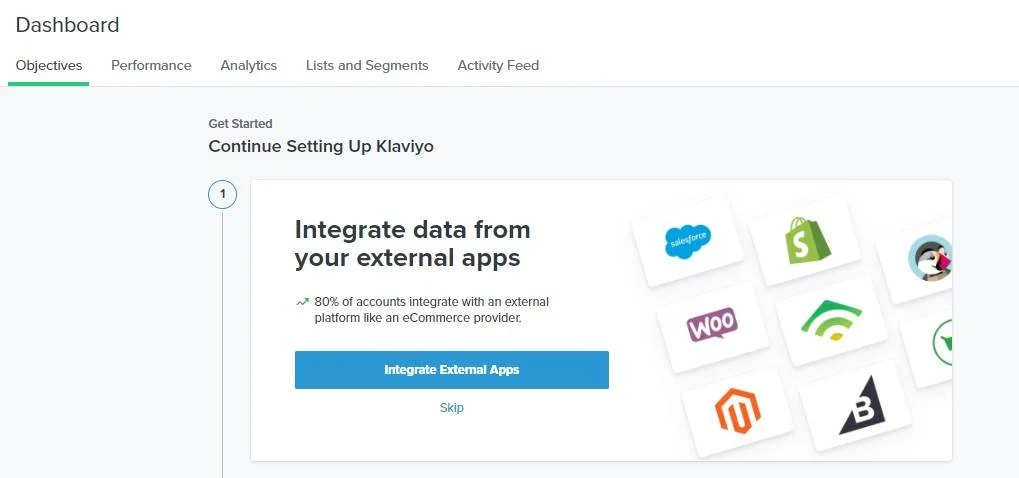
Objectives:
The Objectives tab displays a personalized list of onboarding tasks and ideas that can help you become familiar with Klaviyo. Whenever you are unsure of where to start, take a look at these objectives, and if you see something you do not require, you can simply remove it.
Performance Dashboard:
The performance has 3 main sections:
- Performance across all channels
- Flow Performance
- Campaign Performance
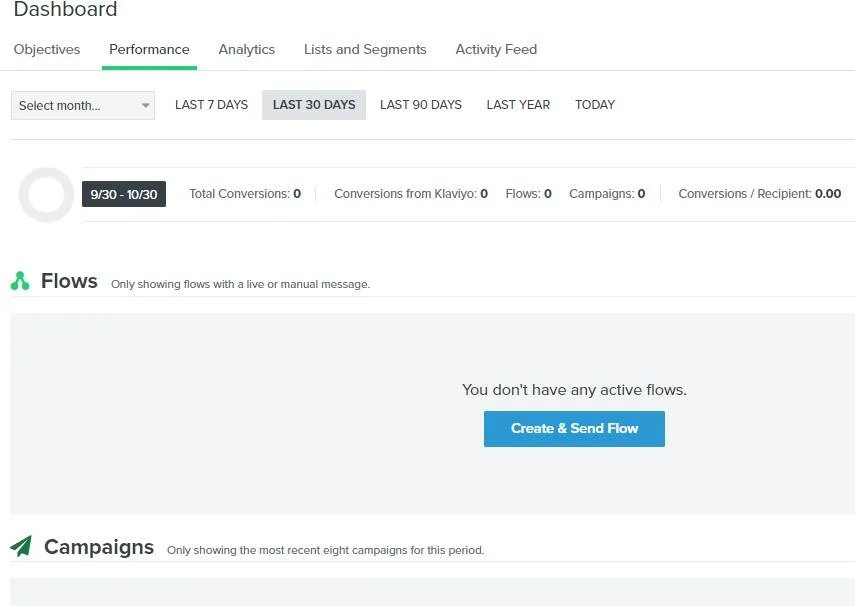
Performance across all channels:
Once you’re here, you’ll be able to filter the time frame along with the metric you want to analyze.
After you have chosen the specific month and timeframe you want the analysis from, you’ll be able to see an overview of your Klaviyo accounts email performance in the following metrics:
Total Conversions performance:
Total Conversions measures how many people completed specific actions in your Klaviyo over the selected timeframe.
This counts the total revenue that has come from all the sources, including your email conversions. The green color represents the conversions from email, with the grey color representing the non-email source conversions.
Performance of Klaviyo Conversions:
This number shows the total conversions from your Klaviyo marketing. This has all the agencies you have ownership over.
Performance of Flows:
The flow reflects all conversion activity for your own channels, here you can see the percentage of activity that is coming from your automated flow.
Performance of Campaigns:
This is the total campaign activity that has taken place over the selected timeframe over your owned channels like Designated Email, messaging, etc…
Performance of Recipient/Conversion:
This provides the revenue earned from each email recipient or conversion. If your chosen metric does not have a value associated with it, the number will represent the overall conversion rate per email received during the selected time period.
Right below the performance of all channels in Klaviyo Dashboard, you will find Flows and Campaign activity.
Flows Performance:
This value reflects the total activity of all automated flows and will only show the flows which have at least one live email. If your conversion metric has a value associated with it, then you will see the value earned for each flow. If your conversion metric doesn’t have a value, it will represent the total conversions for the flow.
Campaign Performance:
The last section is the view of your campaign activity. It displays the recent 8 campaigns in the selected time period. The same as flows, you will see depending on whether your conversion metric has a value, this is the overall revenue earned from each campaign, or it would be the total number of conversions.
Analytics:
Let’s dive into the analytics tab, which shows you the data you need in a number of customizable formats. If you need to know the performance of each metric separately, this will surely prove useful.
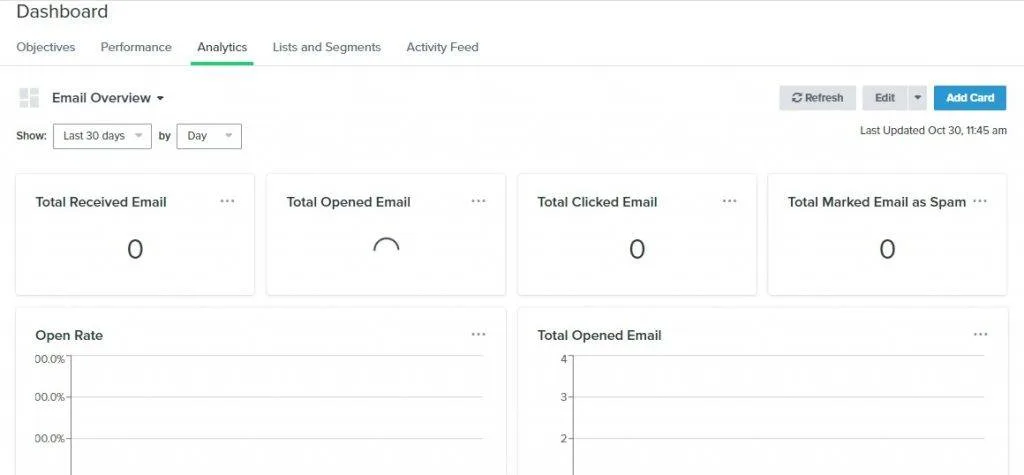
Keep in mind the maximum number of 50 cards per dashboard and a total of 75 Klaviyo dashboards for each Klaviyo account.
Here is where you can see your total open rates, click-through rates, unsubscribe rates for emails, along with many other valuable metrics.
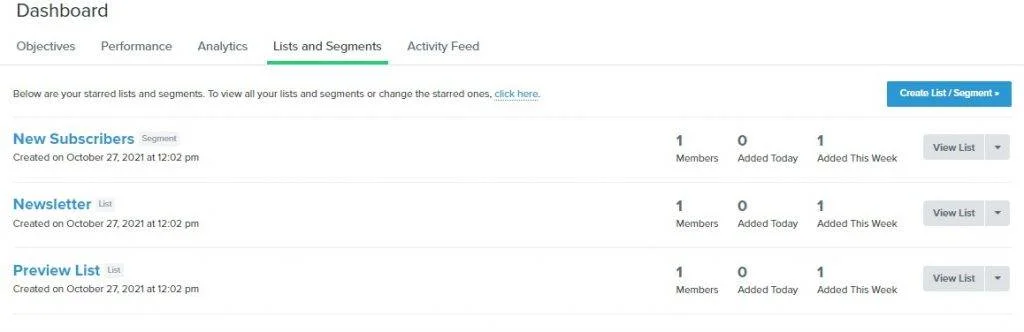
Lists and Segments:
The Lists and Segments tab is ideal for marketers who want to see their lists and segments in Klaviyo dashboard. This section can also be used to create new lists, view the performance of existing ones, and exclude or include lists with ease.
Activity Feed:
The last tab in the Klaviyo dashboard, the activity feed, is designed to give you a quick overview of what’s going on with real-time updates.
On this page, you’ll see a live feed of all the activities that happened in your associated channels.
Now that you have read about how to use the dashboard of Klaviyo, there are numerous pre-made Klaviyo dashboard templates available with different combinations of metrics.
You can download these Klaviyo dashboard templates you want or recreate them to make your own personalized dashboard.
We can also help create these templates for you to take advantage of the Advanced Klaviyo reporting; this is one of the services we do for which you can get a free add-on that is a third-party API connector for Klaviyo and Google data studio.
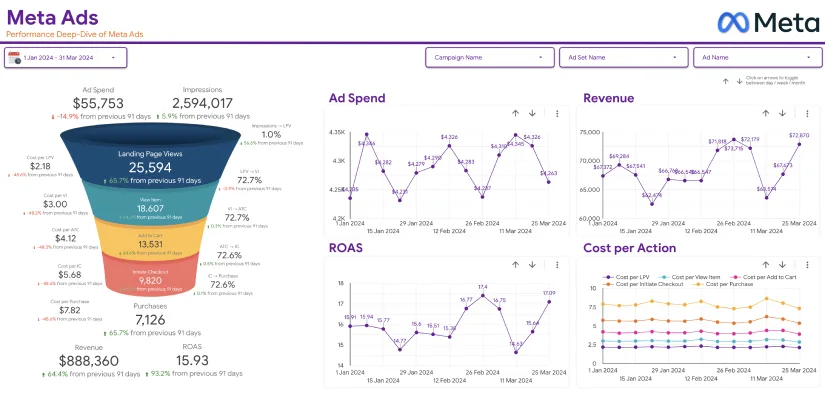
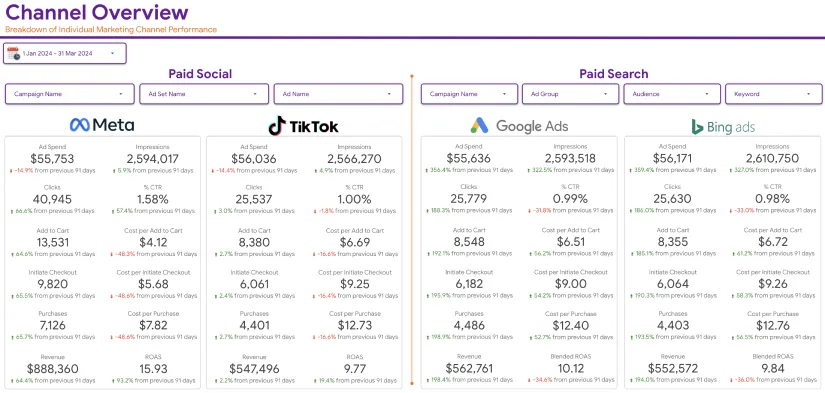
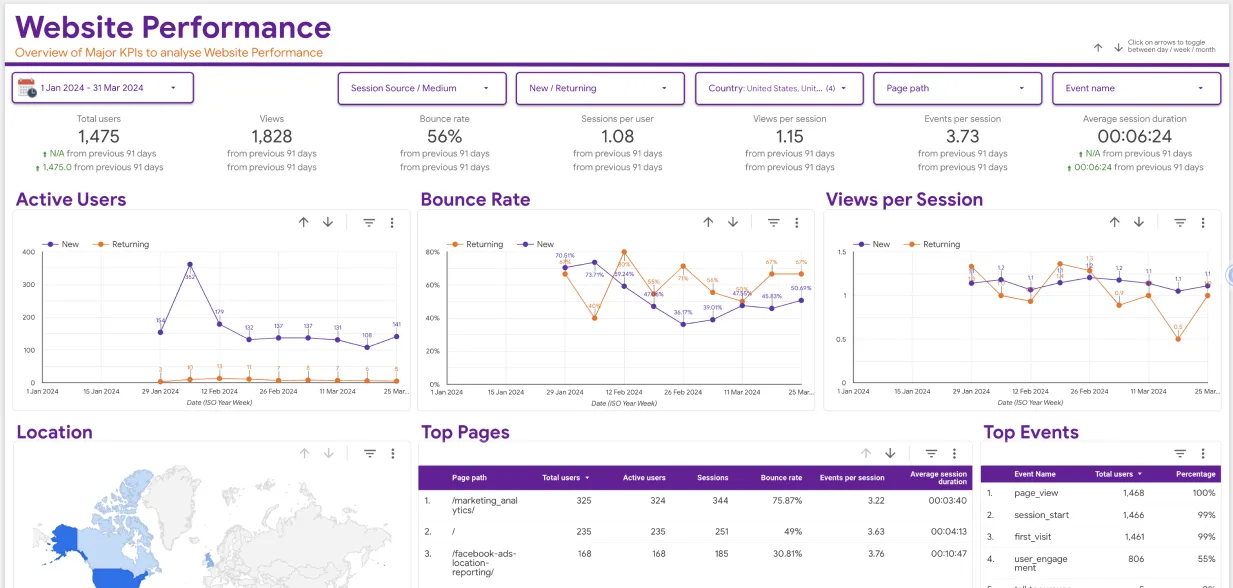
Benefits of integrating Klaviyo with Google Data studio:
Google Data Studio is an innovative free app that integrates with Klaviyo. It provides easy-to-read, shareable reports accessible to all your team members.
These visualizations are useful for teams of marketers because they automatically update when you change data in Klaviyo.
You can combine this integration with third-party API connectors like Stitch, Supermetrics, and our connector, which will be a free add-on service when you sign up for our services.
Here are three key benefits of using Klaviyo Data Studio:
– Ability to see individual account metrics alongside campaign performance at a glance
– Customize reports based on your marketing needs
– Easy to share reports with your team members, stakeholders, or clients.
– This can help create advanced Klaviyo reporting.
– The integration will also allow you to pull data from additional sources, so feel free to connect both your third-party APIs and Klaviyo with Data studio, which in turn removes a lot of man-hours from your work and allows you to focus on what really matters – building a successful business.
The possibilities are endless with these integrations, so connect Klaviyo to Google Data Studio and start using in the way that best suits your needs.
In conclusion:
Klaviyo has been doing a good job in being the premier email marketing platform for e-commerce, so it is no surprise that Klaviyo’s reporting tools are impressive.
Klaviyo provides businesses with an extremely versatile and user-friendly dashboard that can be customized to fit individual company needs. With customizable reports and dashboards, Klaviyo allows marketers to obtain valuable data and insights quickly. Now it’s become easier for you to get your marketing insights as our experts recognize you with the marketing performance dashboard in Klaviyo. It is also possible to build custom report strategy with Klaviyo as it is a powerful tool for tracking and optimizing customer engagement.
The platform also gives marketers access to a number of tools that help them improve their email marketing results. Klaviyo is one of the state-of-the-art email marketing tools available today and gives users’ campaigns a boost through its integrations with Google Data Studio.