Today tracking and analysing search engine optimisation (SEO) metrics is essential for achieving online success. Google Data Studio, a powerful and free data visualisation tool, has emerged as a game-changer for marketers and SEO professionals. By building a comprehensive performance dashboard, you can monitor your SEO efforts effectively, gain actionable insights, and make informed decisions to optimise your strategies.
In this detailed data studio google tutorial, we will guide you step-by-step on how to create an SEO performance dashboard that provides valuable insights into your website’s performance, keyword rankings, backlinks, and more.
Why Use Google Data Studio for SEO?
Google Data Studio is the go-to tool for SEO professionals for several reasons:
- Data Integration: It seamlessly connects to multiple data sources, such as Google Analytics, Search Console, and third-party tools like Ahrefs and SEMrush.
- Customisation: Create dashboards tailored to your needs with interactive charts, tables, and filters.
- Real-Time Reporting: Your reports are automatically updated, ensuring you always work with the latest data.
- Collaboration: Share dashboards with your team or clients, enabling transparent communication and real-time collaboration.
Key SEO Metrics to Include in Your Dashboard
Before diving into the tutorial, it’s essential to identify the metrics that matter most for SEO. A good SEO performance dashboard should include:
- Organic Traffic: Monitor visits driven by organic search.
- Keyword Rankings: Track keyword performance and ranking changes.
- Backlink Analysis: Analyse the number and quality of backlinks.
- Page Speed: Measure the loading time of key landing pages.
- Bounce Rate: Understand the percentage of visitors leaving without interaction.
- Click-Through Rate (CTR): Evaluate how often users click on your search results.
- Conversion Metrics: Link SEO efforts to business goals by tracking conversions.
Step-by-Step Guide: Building an SEO Dashboard in Google Data Studio
Step 1: Connect Your Data Sources
To begin, log in to Google Data Studio and create a new report. Here’s how to connect essential SEO data sources:
- Google Analytics: Provides insights into organic traffic, bounce rate, and conversion metrics.
- Google Search Console: Tracks keyword rankings, CTR, and search queries.
- Third-Party Tools: Use connectors for tools like Ahrefs, SEMrush, or Moz for backlink data and domain authority metrics.
Click on the ‘Add Data’ button.
Select the data source you want to integrate.
Authorise the connection and configure the data fields you wish to include.
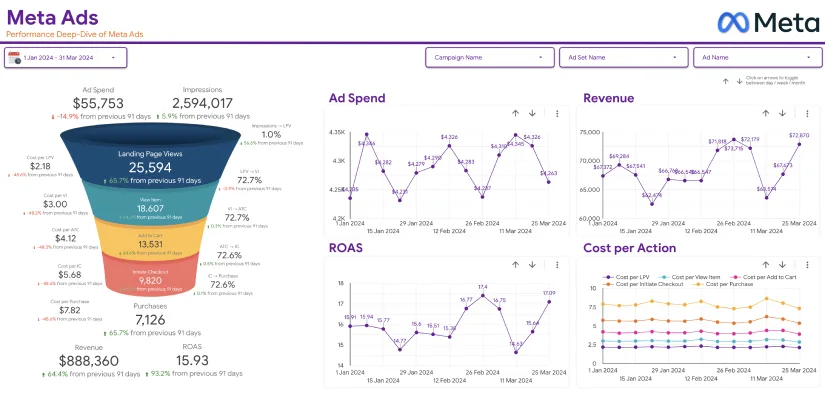
Step 2: Choose the Right Visualisations
Visualising data is key to understanding trends and performance. Google Data Studio offers various options, including:
- Line Charts: Ideal for tracking trends over time, such as organic traffic or keyword rankings.
- Tables: Useful for detailed information, like top-performing keywords.
- Pie Charts: Great for analysing traffic distribution across channels.
- Bar Charts: Compare metrics like backlinks across different time periods.
Select the visualisation type based on the metric you want to display. For instance, use a line chart for organic traffic trends and a table for keyword performance.
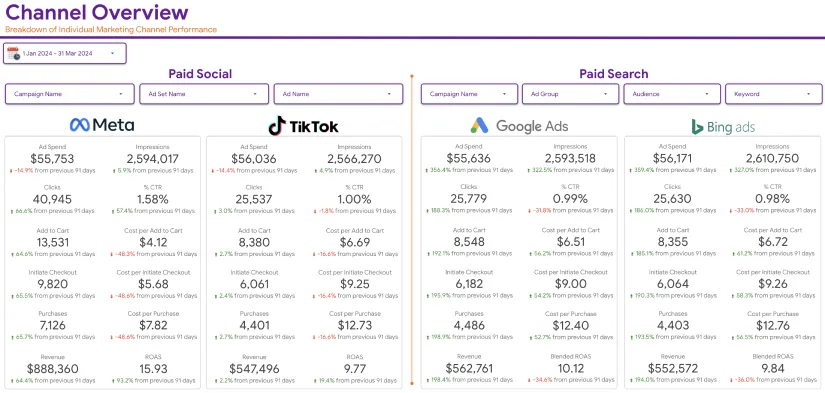
Step 3: Build the Dashboard Layout
A well-organised layout improves readability and ensures stakeholders quickly find the insights they need. Divide your dashboard into sections:
- Overview: Present high-level metrics like total organic traffic, backlinks, and keyword rankings.
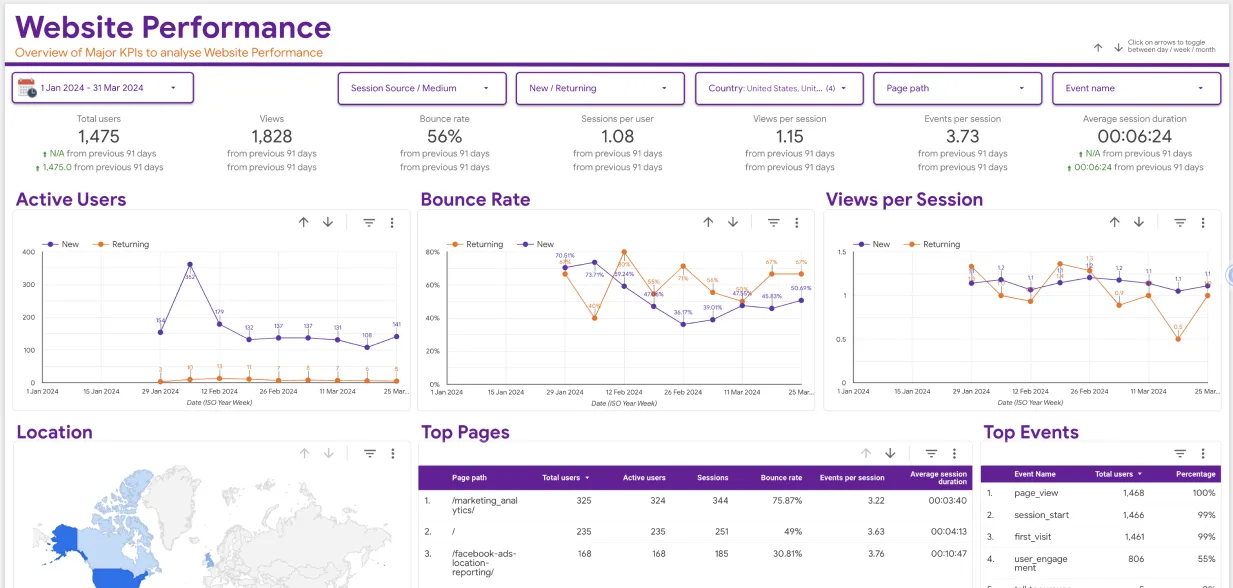
- Traffic Analysis: Drill down into traffic sources, bounce rates, and user behaviour.
- Keyword Performance: Highlight top-performing keywords, average rankings, and CTR.
- Backlink Metrics: Display the number of backlinks, referring domains, and domain authority.
- Conversion Tracking: Show metrics connecting SEO efforts to business outcomes, like lead generation or sales.
Step 4: Add Filters and Controls
Interactive filters allow users to customise the view according to their needs. For example:
- Date Range Filter: Compare performance across different periods.
- Device Filter: Analyse metrics separately for desktop, mobile, and tablet.
- Keyword Filter: Focus on specific keywords or queries.
To add a filter, click on ‘Add a Control’ and select the type of filter you need. Configure it to apply to relevant visualisations.
Step 5: Customise Branding and Style
Make your dashboard visually appealing and consistent with your brand identity by:
Adding your company logo.
Customising fonts and colours to align with your branding.
Using background colours and borders to define sections.
Step 6: Share and Collaborate
Once your dashboard is ready, share it with your team or clients:
Click on the ‘Share’ button.
Choose the access level: Viewer or Editor.
Generate a shareable link or invite specific users via email.
Advanced Tips for SEO Dashboards in Google Data Studio
- Blending Data: Combine data from multiple sources for deeper insights. For example, merge Google Analytics and Search Console data to correlate rankings with traffic.
- Calculated Fields: Create custom metrics like average session duration or cost per conversion.
- Goal Tracking: Import goals from Google Analytics to measure the effectiveness of your SEO campaigns.
- Scheduled Reports: Automate email delivery of your dashboards for regular updates to stakeholders.
Common Challenges and How to Overcome Them
Challenge 1: Data Discrepancies
Different tools often report slightly varying data. Use blending and calculated fields to align metrics for consistency.
Challenge 2: Slow Performance
Large datasets can slow down your dashboard. Optimise by reducing the number of widgets or filtering data before importing.
Challenge 3: Limited Features
While Google Data Studio is powerful, it may lack advanced analytics features. Complement it with specialised SEO tools for a comprehensive analysis.
Benefits of an SEO Performance Dashboard
Building an SEO performance dashboard in Google Data Studio offers several advantages:
- Time Efficiency: Automate data updates, reducing manual reporting efforts.
- Holistic Insights: View all critical SEO metrics in one place.
- Data-Driven Decisions: Use real-time data to refine your SEO strategies.
- Enhanced Collaboration: Share dashboards with stakeholders for better alignment.
Conclusion
Creating an SEO performance dashboard in Google Data Studio is a powerful way to track and optimise your SEO campaigns. By following this data studio google tutorial, you can build a customised dashboard that provides actionable insights into organic traffic, keyword rankings, backlinks, and more. With its flexibility, integration capabilities, and real-time updates, Google Data Studio empowers you to make data-driven decisions and achieve your SEO goals.
Start building your SEO dashboard today and transform the way you measure and report your search performance!
Visit us at Eaglytics Co to find more.