Introduction
Data analytics and digitalization are transforming the way e-commerce businesses operate. By tracking key metrics, companies can gain valuable information that leads to better decision-making and increased success in the competitive online marketplace.
In this article, we will explore the significance of data analytics in e-commerce and the essential metrics to track and unlock the true potential of any business.
What Is Data Analytics?
Data analytics involves:
- Taking raw data.
- Understanding it.
- Transforming it into valuable insights, patterns, and trends.
- Making conclusive decisions with its help.
The four main types of data analytics are:
1. Descriptive Analytics: This type helps us understand past events by looking at data and finding patterns or essential numbers. It involves using basic statistical techniques to answer “what happened” questions.
2. Predictive Analytics: It uses data to guess what might happen in the future. It helps answer “what is likely to happen” questions.
3. Prescriptive Analytics: Prescriptive analytics comes after predicting the future by suggesting the best action to achieve a specific goal. It helps to answer “what should we do next” to maximize desired outcomes.
4. Diagnostic Analytics: This kind of analytics helps us figure out why something happened in the past. Diagnostic analytics helps in answering questions like “why did it happen”.
What Is E-Commerce?
The complete form of E-commerce is electronic commerce. It involves purchasing and selling goods and services “electronically” that is online through the help of the Internet. E-commerce allows people to shop from the comfort of their houses instead of going to the shops physically.
Such websites and platforms provide a wide range of products and services from various sellers. Digital payment methods like credit cards, mobile wallets, and online banking enable secure and convenient transactions.
Data Analytics and E-Commerce
Data analytics plays a crucial role in E-commerce, allowing businesses to interpret and use the large amounts of data generated through online transactions for their benefit. Using data analytics, e-commerce companies can get important information about customer behavior, preferences, and trends.
Tracking key metrics is a part of data analytics; when it comes to e-commerce, it involves monitoring and measuring specific performance indicators, also known as a key performance indicator (KPI).
Key Metrics to Track
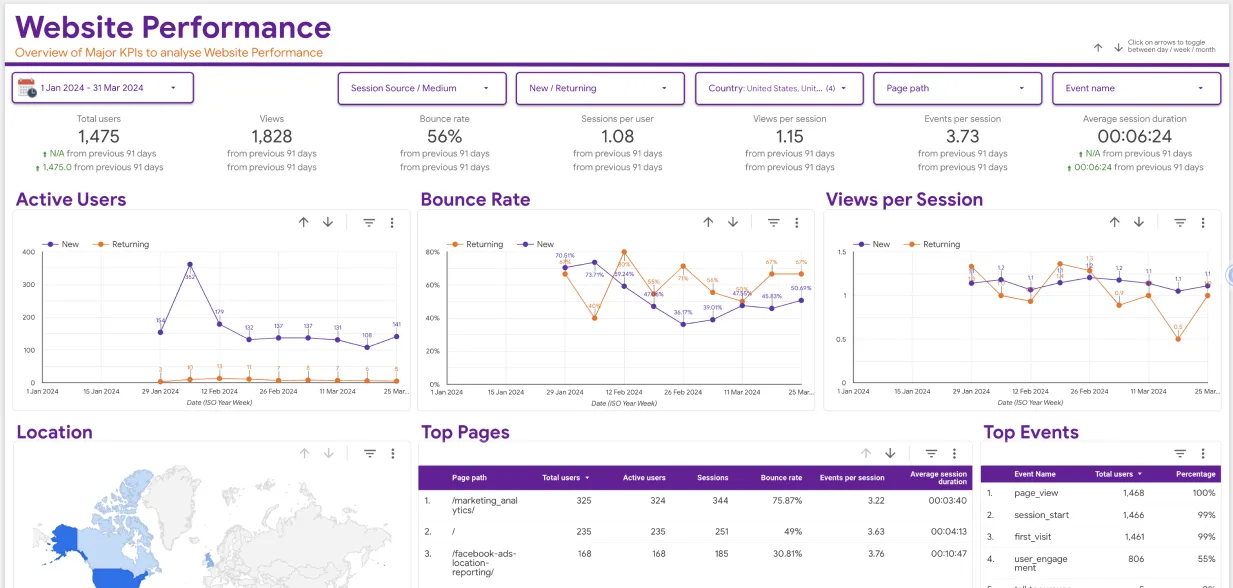
Conversion Rate: The conversion rate is a crucial e-commerce metric measuring the percentage of people who visited a website and completed a favorable action, such as purchasing an item.
It helps to see how many website visitors did become our customers. Tracking the conversion rate allows businesses to understand the effectiveness of their website design, user experience, and marketing strategies.
Customer Acquisition Cost (CAC): Customer Acquisition Cost measures the average cost of gaining a new customer. It includes marketing, advertising, property, equipment, and sales expenses incurred to acquire a customer.
Knowing the Customer Acquisition Cost (CAC) helps e-commerce businesses understand how effective their marketing campaigns are and which ways to bring in new customers are more affordable.

Average Order Value (AOV): Average Order Value represents the average amount customers spend in a transaction. We can calculate it using this formula:
Total Revenue/Total Number of Orders
Tracking AOV allows businesses to assess the effectiveness of upselling and cross-selling strategies and check the transaction patterns. It also helps companies to find ways to make more money. For example, they can give discounted prices to customers who buy more expensive items or bundle products together to encourage customers to spend more in one order.
Cart Abandonment Rate: The Cart Abandonment Rate is a significant e-commerce metric measuring the percentage of website visitors who add items to their shopping cart but exit without purchasing.
High cart abandonment rates can show potential issues with the checkout process or unexpected costs, such as high delivery charges or sales tax, that discourage customers from completing their transactions.
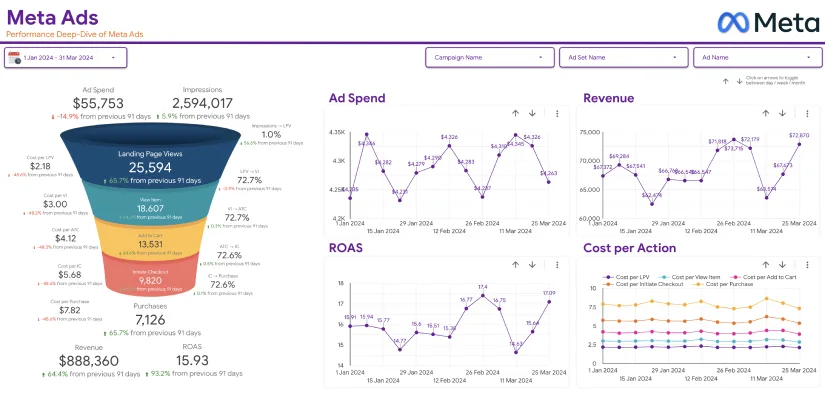
Return on Advertising Spend (ROAS): Return on Advertising Spend (ROAS) is a crucial metric that measures the revenue earned from advertising campaigns compared to the amount spent on those campaigns.
It shows how effective an e-commerce business’s advertising efforts are. By tracking ROAS, companies can determine the profitability of their ad campaigns. With the help of this knowledge, businesses can make informed decisions about where to allocate their advertising budget to maximize their business growth.
Customer Retention Rate: Customer Retention Rate measures the percentage of customers who continually make purchases from the business over a specific period the company has “retained” the customers. A high retention rate indicates that customers are satisfied and loyal to the brand. It also means that the business has successfully built a relationship of trust with its customer base.
Product Performance: Tracking the performance of individual products is essential for e-commerce businesses to understand which products are the most popular and driving the most revenue.
Analyzing product performance data helps companies to make informed decisions regarding inventory management, pricing, and promotions. By identifying the top-selling products, businesses can direct their marketing efforts more toward them.
Churn Rate: Churn Rate measures the percentage of customers who stop purchasing from the business over a specific period. High churn rates can indicate many issues, such as customer dissatisfaction or poor product quality. By identifying the reasons for customer churn, e-commerce businesses can implement strategies to reduce the number of customers leaving.
Mobile vs. Desktop Traffic and Conversion: Monitoring website traffic breakdown and conversion rates between mobile and desktop devices is crucial. Today, many customers use smartphones and tablets for shopping, so understanding this data is essential for e-commerce businesses.
By analyzing mobile vs. desktop traffic and conversion rates, companies can determine the user experience on different devices. Hence, this knowledge allows them to tailor their website to provide a seamless user experience for both mobile and desktop users.
Bottom Line
In conclusion, data analytics is a game-changer for e-commerce businesses. Businesses can make informed decisions to optimize their strategies and enhance overall performance by tracking key metrics. Data analytics’ potential to unlock new opportunities for the e-commerce industry is limitless as technology advances. Experience the incredible potential of Eaglytics, the all-in-one digital marketing analytics solution! Whether you need customer targeting, social media marketing analytics, or business analysis, you can always rely on our top-tier services. Give Eaglytics a try now and soar high in the business realm!