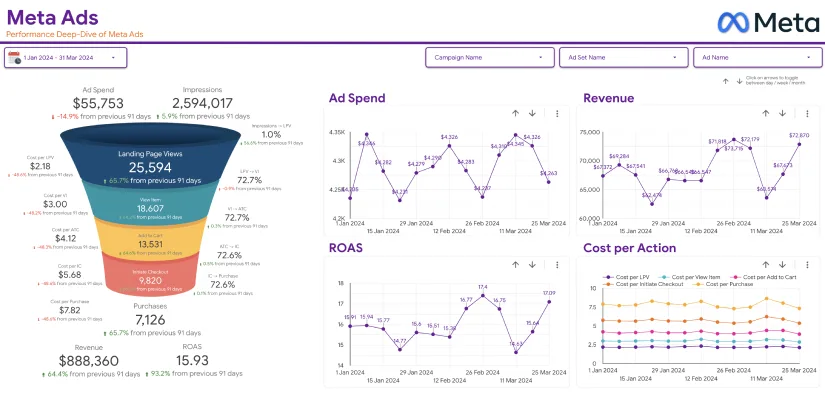
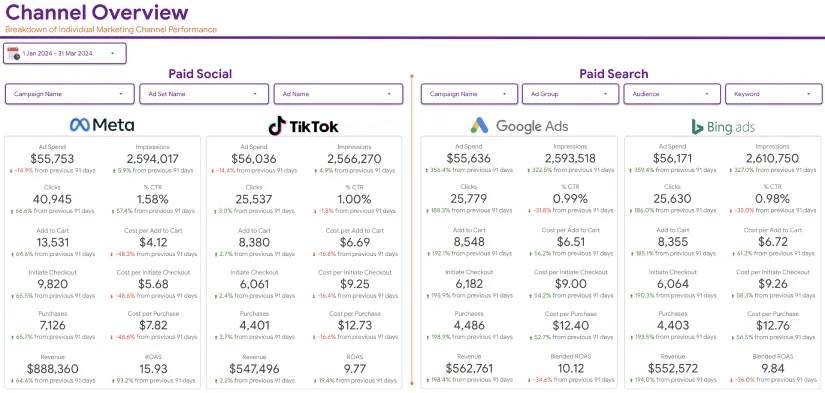
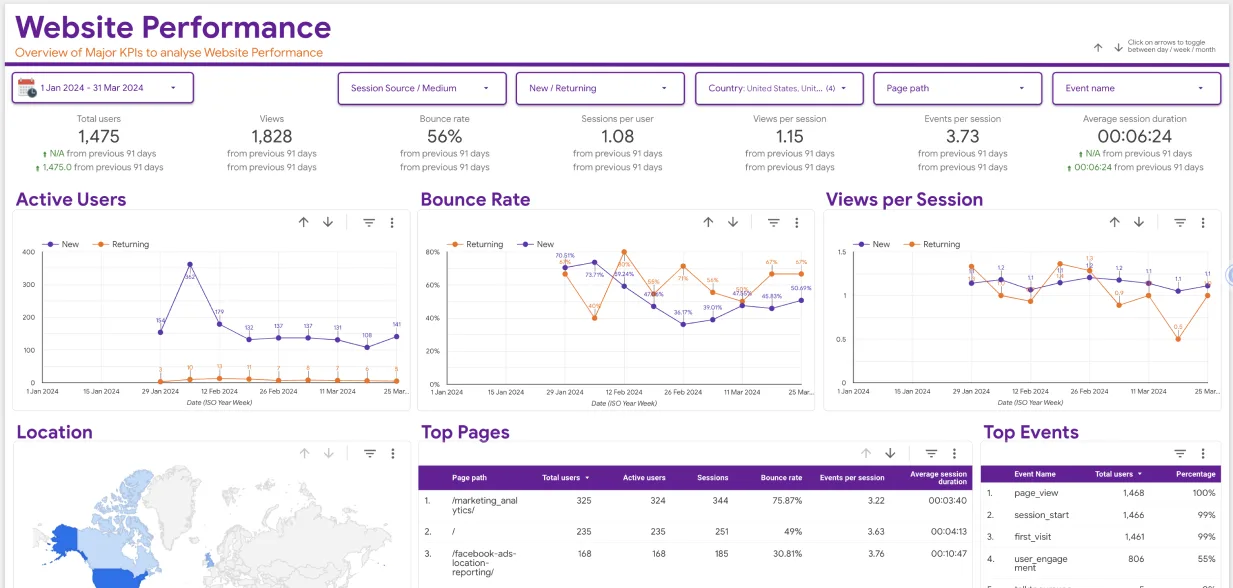
Many businesses and brands are now using other social media platforms, but Facebook rules the roost when it comes to social media marketing. The impressive knowledge you obtain from the Facebook dashboard Insights regarding your posts or ads, tracking campaigns, demographics of your targeted audience is much better and knowing the top Facebook KPIs for ads helps keep your business growing digitally.
Statista estimates that more than 2.8 billion people use Facebook every day, and globally, people are spending an average of 2 hours and 24 minutes on Social Media each day. There are a lot of eyeballs if you want to advertise your product or service to them.
With the iOS 14 update, it is even more important to keep a close watch and track the performance of our ads. However, following all metrics is daunting and a confusing task. Combining that with monitoring the performance of multiple campaigns for multiple clients can be a challenge.
So, having a set of Key Performance Indicators, aka KPIs for Facebook ads and Facebook ads dashboard templates, helps you get a birds-eye view of everything you need to know to improve the content, understand the demand & invest in ads wisely.
To succeed in today’s digital world, you must measure everything. But measuring success isn’t easy. How do you determine whether your campaign was successful? What facebook KPIs to measure? Which Facebook ads KPIs matter most?
Proper KPIs are essential to measuring the performance of your campaign. This blog post will help you understand which KPIs matter and the KPIs on Facebook that is worth tracking.
List of The Top Facebook KPIs(Key Performance Indicators) for Ads Campaign:
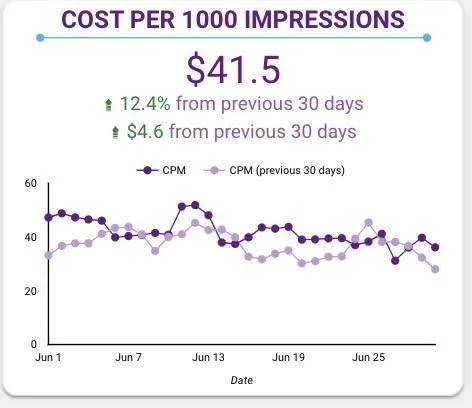
1. The Cost Per 1000 Impressions KPI:
Cost-per-impression, also known as cost-per-thousand-impressions or CPM, refers to how much advertisers spend on getting their advertisements displayed to users. This Facebook KPI is mainly used to evaluate the efficiency of an advertising campaign. The general formula for calculating CPM is:
Cost-Per-Impression (CPM) = total cost/number of impressions generated
While it’s tempting to think of impressions as simply an indication of exposure, they actually provide valuable insight into your advertising strategy. A high impression rate might mean you have a lot of competition vying for attention. On the other hand, a low impression rate might indicate that you aren’t reaching enough potential clients. Either way, understanding your CPM lets you fine-tune your strategies.
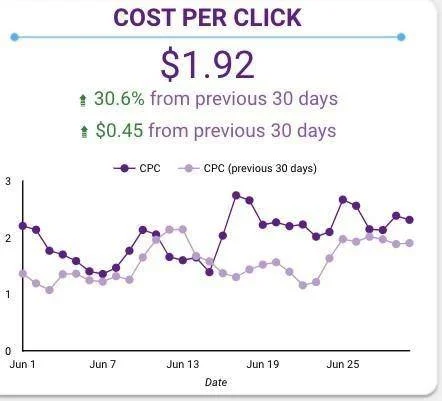
2. The Cost Per Click (CPC):
The Cost-per-click, also known as CPC or PPC, is the amount you pay when someone clicks on your advertisement. The general formula for calculating cost per click is:
Cost-Per-Click (CPC) = total cost/number of clicks generated
In spite of appearing to be an easy way to evaluate your campaign performance, it can be misleading. For instance, a higher click rate may indicate that the advertisement is too popular and people are clicking on whatever they see in hopes of finding something better. In contrast, an ad with a lower cost-per-click might also mean your target audience isn’t interested enough to actually click on anything.
As such, you should use this Facebook ad KPI to get the complete picture of how successful your campaign has been so far.
3. The Cost Per Lead (CPA/CPL):
Cost-per-lead, also known as CPA or CPL, is the amount you pay when someone fills out your contact form on your website to receive more information. The general formula for calculating cost per lead is:
Cost Per Lead (CPL/CPA) = total cost/number of leads generated
This metric is often used to gauge the effectiveness of an advertisement. For example, if you spent $500 and received two leads from it, your CPL would be $250.
Cost per lead is an important metric because it helps you figure out how much money you’re spending on leads and what your return on investment will be.
With CPL, you can see how many leads your ads generate and how much each of those leads costs. This way, if one ad has a higher cost per lead than another, then that means it might not be as effective at generating conversions for your business.
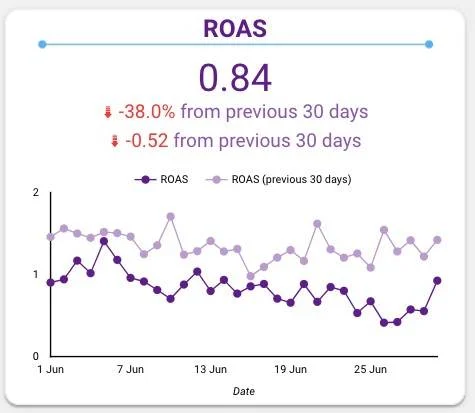
4. The ROAS – Return On Ad Spend:
ROAS is a crucial metric that indicates how effectively your ads have been performing. It calculates the conversion rate of an ad by dividing the total revenue from your campaign with the total Ad Spend. For example, if you’re spending $100 per day and generating $2000 in revenue, your ROA would be 20x ($2000/$100).
The basic idea behind ROAS is to get back more money than what was spent on advertising. ROAS is also one of the most important Facebook KPIs for affiliate sites. The higher this number becomes, the better it means your marketing budget has been well managed and successfully generated a return for your business. This ratio can also help determine which type of advertisement provides better results.
5. The Click Through Rate (CTR):
A click-through rate indicates the number of times people clicked on your advertisements. It’s calculated by dividing the number of clicks generated by the total impressions from an ad campaign.
If, for example, 100 people out of 1000 saw your advertisement and five clicked it, then CTR would be 10%. The higher this metric becomes, the more likely customers are to interact with what they see in a way that generates ROI for marketers.
This value can also help determine which type or format of ads work best for generating traffic, such as text versus video ads. For instance, videos might attract more attention than other formats because they demand viewers’ focus; however, these same videos may not generate more clicks/leads.
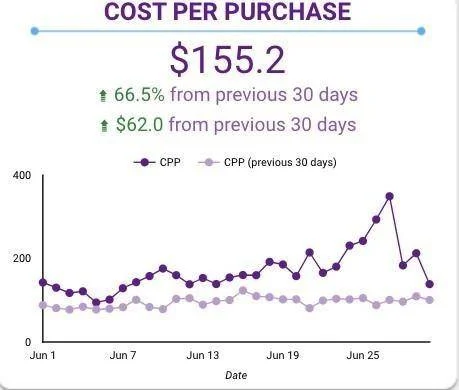
6. The Cost Per Purchase (CPP):
This KPI for Facebook ad campaign calculates the cost of purchase on Facebook. You calculate this by dividing your total marketing spend by the number of purchases you’ve made to get an average CPP.
For example, if you spent $100 and made six purchases, then your CPP would be $16.67 ($100/6). This number can be used to determine which type of ad generates the most conversions for a business. For instance, one advertisement might have a lower click-through rate but higher conversion rates because it conveys its message more effectively than another ad that shows up in people’s news feeds.
7. The Average Order Value:
This metric is similar to CPP, but instead of focusing on purchases, it focuses on how much money the average order for a business makes. To calculate this number, divide your total revenue by the total orders made and multiply that value by 100 (to make this easier: Revenue/orders x 100).
For example, if you earned $500 in revenue from 10 orders, your AOV would be $50 ($500/10), which means that every purchase averages out at about $50 per customer who buys from your store.
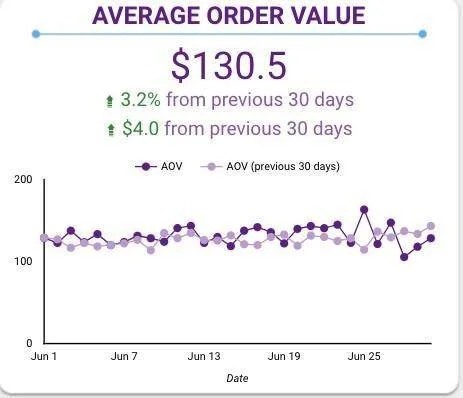
A high AOV is crucial to any business because it means that you’re making more money off of each order which means that you’re able to make more and better products for your customers. Also, keeping up with customer demands will be easier since you won’t have to worry as much about the number of orders you receive.
Even With the Top KPIs for Facebook, it’s Hard to Keep Track of all Your Marketing Efforts:
These are the top KPIs for Facebook you need to closely track, observe and monitor to get needful insights to know what lacks in your business or creative ads and improvise it.
Having these as your top Facebook ad KPIs is a great first step.
But things get difficult when you need to create Facebook ads reports for clients with proper insights, no matter whether you manage multiple clients, or even a single client, copying the data from Facebook Ads Manager onto your reporting spreadsheet is going to take countless hours each month, and that’s where we can help.
We at Eaglytics provide analytics dashboards for marketers that are easy-to-use and help you keep track of KPIs for Facebook analytics and Google Analytics – no coding required!
We create dashboards that act as a single source of truth and help showcase your marketing efforts to clients and improve your service offerings and reputation.
With our dashboards, you’ll get a complete picture of what’s happening in your digital world; then, you can decide where you will invest your time and energy for maximum benefit.
We saved Sugatan, a US-based Ecom Agency, 20-25 hours a month by setting up a 100% automated reporting system. If you’d like to save time and increase productivity by allowing you to spend more time doing work than keeping track of it, please reach out to us by clicking here.


