As a serious online marketer, you should embrace advanced Google Data Studio for reporting. As you might know, Google Data Studio is one of the best free visualizations and reporting tools. It has excellent features that allow digital marketers and other users to create good-quality reports. With GDS reporting, you can track and measure the performance of each advertising campaign you have. And it is easy and fun to create data reports on GDS because it has several data connectors and idiot-proof tools for the process. Although you can pull complex information into visual charts and graphs, that is not all you can achieve with GDS. To create even better statements, you can attempt advanced reporting. It entails adding some elements to a report to make it stand out. Before sharing 15 of these elements, we will briefly describe the advantages of GDS.
Benefits of Google Data Studio for reporting
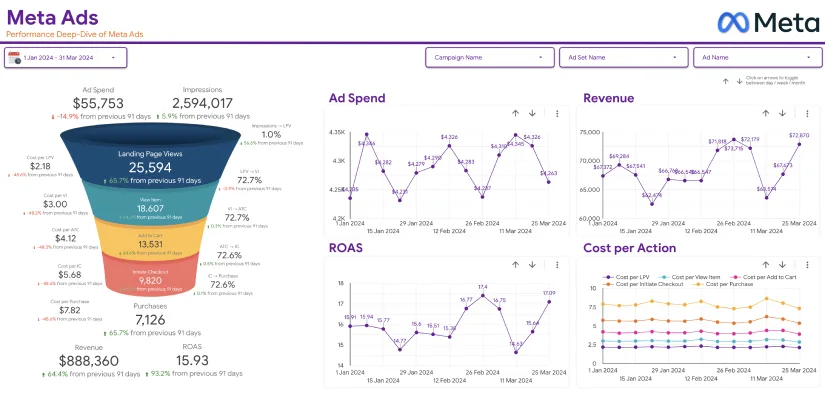
When it comes to choosing the right tool to create reports in, Data Studio is the best. It contains different data sources inside it. With over 800 plus premade datasets, and over two hundred and seventy connectors, you can achieve a lot with GDS. Also, it contains multiple pages function to ensure that you prevent information overload on one page. Furthermore, it consists of two kinds of filters: include and exclude filters. You can easily create a google analytics report using the Google Data Studio analytics template when it needs Google analytics reporting. Also, Google data studio facebook ads dashboard template for Facebook ads reporting.
Hence, you can filter your groups, pages, reports, charts, and filter controls. Data Studio also contains page and report-leveled elements. So when you add something to the report, it will appear on that page only. If you want to see the same thing on other pages, you can use the page and report-level feature. Apart from all the above, Google Data Studio has many free templates, dashboards, and easy-sharing options. Also, you can create custom javascript visualizations in Google Data Studio.
Importance of advanced Google Data Studio Reporting

As a marketing director, you can no longer depend on manual report creation. You require GDS because it can generate reports quickly and let you respond to issues before they worsen. With automated reporting, you can avoid data errors caused by humans. Besides, you can do away with routine work and help your staff become more productive. Again, you can readjust the advertising budget based on what the data studio reports are showing. And when you add given elements to your statements, they can look more professional and helpful for the stakeholders and customers. But how can you stop making typical reports in GDS?
15 Elements to take Google Data Studio for reporting to the next level
Which elements make your Google Data Studio reporting outstanding? It’s important to add some elements in your advance reporting. Find them below:
1. Use the Master Google Sheet
For the information you want to insert into several data reports, you can use Master Google Sheets as the content management system. Then you can have an easier time updating all the report data across all clients. An example of this would be a table of definitions. Such a table would describe a transaction, a session, or any other thing that your clients ask about regularly. Once you add this table as your last page, you can link to it and avoid writing the same thing again for every client you have.
2. Insert Google forms
The next element to insert when doing advanced Google Data Studio for reporting is Google forms. It is necessary to do it when you want people to recommend changes to a report. To start, place a link in the footer to connect to the last page requesting feedback or changes. Feedback will then emerge in the Google Sheets or any other visualization tool you have. As a result, you can manage and maintain feedback more effectively.
3. Add Advanced Date Ranges
You can use advanced date ranges when your clients request to view the performance of their business differently. By default, Data Studio provides several date range options. However, these may be insufficient as per your clients’ requests. At this point, advanced date ranges can help. So, go to the comparison date range selector and choose Advanced from the list. Next, select a fixed start date by accessing the previous calendar year. After that, select the day that compares with the 1st date in the current year. Next, set the end date by choosing Today and then Minus. After that, type in 365 to represent the number of days.

4. Rounded corners and drop shadows
If you release reports often, you might want to be consistent with your styling techniques. One way to create lovelier reports is to create rounded corners. By selecting a perfect setting for rounded edges, you can ensure that your charts and tables look presentable. Additionally, you can improve their appearance further by adding drop shadows.
5. Upload an image and create a color palette for each client
During advanced Google Data Studio reporting, you can make a color palette in the data reports that suit each client’s branding and colors. We always do this for our clients. Just like us, you could do the same. So how can one do this? Using Extract Theme from Image, you can pull your client’s site, blog, or branding colors into default graph colors. You can then use an image creator like Photoshop. Ensure that you add image courtesy or author.
6. Add images to tables
If you want to add images to tables, you can do it in GDS. However, the option only works when using standard tables. For other types of tables and charts, you cannot use images in them. Also, it is a courtesy to include an image author when it does not belong to you.
7. Use heatmaps or bar tables
If you want to make your keyword research look more professional and presentable, there is a way out in Google’s data studio. With the use of heatmaps or bar tables, you can make your keyword research appear better than it does in Google Sheets.
8. Interactions-Use filters
GDS now provides better selectors than it did previously. To apply filters, click on an object inside a pie chart and watch as it filters the entire report or a specific group.
9. Grouping charts with filters and data control

In advanced Google Data Studio reporting, you can use the grouping option. So when filters update, only charts within the grouping will update rather than the whole report. When you want to add different kinds of charts to a report, each using specific filters, first add charts and filters to it. Then highlight all of them, right-click your mouse, and choose the group. All highlighted items will be in one cluster that is easier to move at once.
10. Use calculated fields
To clean parameters, the best solution to use is calculated fields. Stripping parameters from different sources from Google Analytics is doable but not easy. You, therefore, need a plan and the best is calculated fields. These look like your typical excel formulas. So, create custom formulas first to help you come up with calculated fields.
11. Create percent change columns
It is essential to measure the difference between an old value and a new value as a percentage expression. You can see the extent of change that has happened over time. Google Data Studio has a feature that computes percent change over time. This being an included feature, it can be hard to implement sort and filter to a column calculating the percentage change. So you need to create a calculated field that can solve the problem for you.
12. Enable sorting
During advanced Google Data Studio for reporting, you can make interactive reports by activating sort on the charts. You can also push meaningful insights with Sort By on any metrics appearing in your report. These metrics can be URL clicks, landing pages, URL CTR, and impressions.
13. Add many pages to one report
GDS can enable you to show various types of data in one report using many pages. To generate pages, click Page and then choose one of the choices you will see. If you like the format, duplicate the page and edit other content. To add a page, choose the Add a page icon. After generating your pages, alter the Data Sources and Style of a page in the Current Page Settings. Once you click on Select Data Source, scroll down until you see all integrated data sources. Next, add them. To make the newly made page look like the first page, duplicate the page to copy your old charts and data into the new page. As well, you can edit the data to suit your goals. Lastly, label your pages.
14. Indicate high-interest values

It is possible to add reference lines to your Data Studio Charts. These can be horizontal or vertical lines. They will show how the information in the particular chart compares to a given reference value. An example of this can be an average order value chart showing how main products compare to that average. There is one thing to note, though. Reference lines are easy to add to the bar and column charts, combo and line charts, time series, and scatter charts.
15. Create blended data fields and insert blended data into a chart
It is possible to import data from various advertising campaigns in advanced Google Data Studio reporting. But importing is not enough if you cannot compare this data. So with Data Studio’s blended fields, you can combine data from different platforms with a shared data point.
You can therefore merge four data sources at once. All in all, it is impossible to connect all kinds of data points as they must have a common dimension (join key). To start blended data fields easily, begin with your primary data source and add secondary data sources next.
Always blend information in reports and not anywhere else. Once more, you can add multiple blended data into a chart. To blend data, go to Resource and then click manage blended data. Add a second data source and use one dimension as your join key. After gathering enough join keys, now add blended data into a report. Then make a chart using that data.
We hope that the 15 features we have shared will let you create beautiful reports for your clients and create an interactive dashboard every time. To succeed in advanced Google Data Studio for reporting, you also have to understand how to create excellent marketing reports. Remember that automated reporting can help you make crucial decisions quickly based on large volumes of data. When you track your marketing activities, you can evaluate different factors, including:
- How well your best is selling and attracting new clients
- Measuring the success of your digital advertising methods or channels
- How well you can alter your budget without facing risks.
Conclusion
Until you create excellent reports, you cannot gain control of your operations. After creating reports, you can then advance them with the features we have discussed above. As well, you can update each report in real-time and present data in the most comprehensible manner. Proper preparation is the surest way of creating reports that provide correct and reliable data. It also entails ascertaining that you have critical metrics for your business. With everything ready, you can make advanced reports in GDS.