Google Data Studio offers users different tools and features for their data analysis. It is a data visualization tool with easy to share dashboards. It offers an intuitive interface or design, making it straightforward to learn and use. Initially, data studio users couldn’t combine several data sources in a single visualization. It’s one of the limitations of data blending in Google Data Studio. Nevertheless, with the introduction of the data blending feature, it is possible to combine multiple data sources.
You can configure Google Data Studio integration with traditional Google applications such as BigQuery, Google Ads, Google Sheets, and Google Search Console. You can also combine Google Data Studio with Shopify, Facebook Ads, MailChimp, and other third-party tools.
With this, you can have all your companies’ data in a collective place. However, connecting all data sources isn’t enough; there is more. This article will learn how to blend in Google data sources in Data Studio. Are you ready? Let’s get started.
Understanding Data blending
Data blending involves the combining or blending of multiple data sources in a single chart or graph in Google Data Studio. The only requirement you need to blend is a Google Data Studio. An example would be when several Google Analytics views are set for a particular website. You might have a Desktop and Mobile view. To blend several data sources, each data source must include a “JOIN key.”
One important thing about data studio is it looks for the JOIN key, which you can change manually. However, if the data studio fails to identify a JOIN key, it will display a message on the Data Blend Panel “Missing.” In the course of blending Google data, you must manually select the dimensions and metrics you want to include from each data source.
Understanding Data Joining
Assuming you manage an online store and want to run paid ads through multiple social media platforms. You need to check your performance after completing the ads. You would want to discover the channel that produces the best revenue or clicks. To achieve this, you have to integrate or combine your data from the paid ads.

Alternatively, you had an eCommerce campaign and want to see the outcome of your marketing funnel. You want to see the pages customers visit most or the product they added to their cart before buying. You have to connect Google Analytics Data with Shopify data to get this information. The two scenarios represent a rough explanation of data joining.
When you join data from several data sources to a single dataset, it is known as data joining. It works when different data sources are joined and shared at least a common dimension. Normally, businesses gather data from different sources during their ads campaigns. If a business decides to neglect to combine all the data, they miss the overall performance of their campaigns. Hence, you could see the importance of data joining. Data joining helps in the following ways:
- Enable better decision
- Determine important link between data sets
- Disclose valued insights from distinct data sources
Types of JOINs
There are four different types of joins in Google data studio.
- Outer Join – Involves collecting all data from both sources
- Inner join – It involves merging data from both sources where the join keys are the same. Here, if the data doesn’t match, it drops the data.
- Left Join – Involves collecting data from the left table and the data that match from the right using the same Join keys.
- Right joins – It’s the opposite of the left join where data are collected from the right and match with that of the left using the same join keys.
Purpose of Blending Data in Google Data Studio
Accounting is an important thing that requires accurate data. It can be confusing and complicated when you don’t know how to use the data. However, blending data using visualization software can come in handy. There are two reasons for blending data in Google Data Studio.
Performance assessment

Assuming you set up a new promotional campaign simultaneously on Facebook Ads and Google AdWords platforms. After completing the advertisement campaign for a particular period, you might want to access the expenses during this period.
To do this, you have to blend data from different data sources you used – Facebook Ads and Google AdWords and display the data in a single place – Google Data Studio. With the Data studio, you can easily assess the performance of your advertisement campaign through the dashboard.
Data Fullness
Regrettably, for a newbie, Google Analytics could get complicated. Besides this, Google Analytics data can be incomplete. Therefore, to get complete details of what happened or the event, you have to blend data using additional data source.
Let’s assume, you have a website with several support tickets with several “contact me” applications. To view the connection between the support tickets and leads, you need to blend your Google Analytics account data with your website.
Why Data blending is useful
Nowadays, the amount of data accessible to businesses is on the increase. To discover several insights in a more faster way, there is a need for blending data sources. With this, business owners and marketers can utilize the information to make better-informed decisions.
Data blending tools enable non-technical users to do things previously impossible. For instance, marketing departments can efficiently blend data from their customer relationship system. In addition, data blending comes in handy for rapid analysis and ad hoc reporting.
How to Blend Data in Google Data Studio
Blending data or data integration in Google Data Studio displays single data from multiple sources. If you haven’t blended data using Google Data Studio, we will explore a detailed step-by-step guide to overcome the limitation of data blending in Google Data Studio.
Today, you will find several explanations online on blending data in Google Data Studio. Most of this content is confusing and complicated, making the entire process hectic. How about you blend data like a piece of cake? You will understanding everything in this step-by-step guide on blending data on Google Data Studio.
Step 1 – Select Charts
To start, you need to place both charts close by under the identical report page.
Step 2 – Blending Data
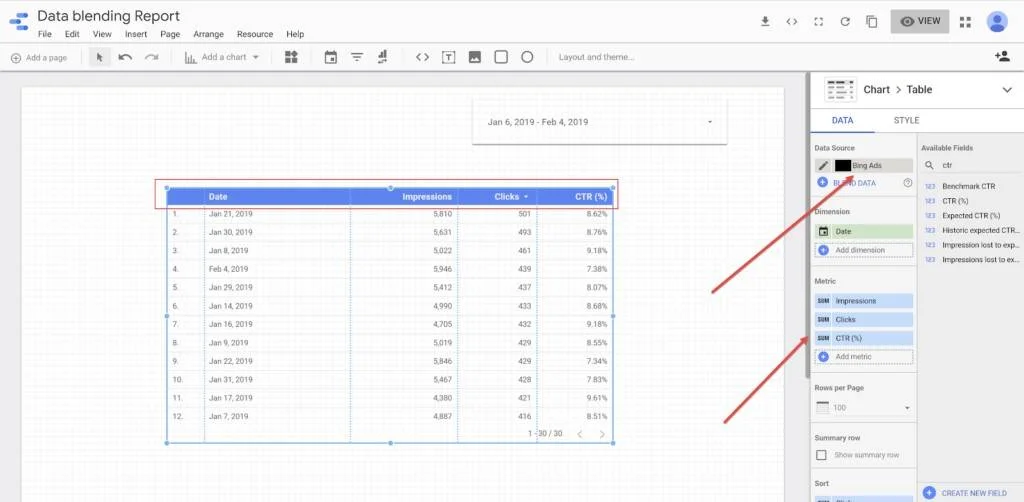
You need to select both charts you want to blend to continue blending. You have to do it simultaneously- click on the left mouse button while holding the shift button on your keyboard. After selecting both charts, they will be highlighted. After this, you need to head to the Google Data Studio console and select “Blend data.”
Step 3 – Creating the blended Data
After pressing the “Blend Data,” if you follow step 2, then you are a step closing to blending data in Google Data Studio. The tool uses an automatic data combination tool. Once you finish the previous step, a new chart will be created from the data you blended from the previous charts.
Interestingly, you can adjust the newly blended data chart by means of changing dimensions, adding metrics, and adding additional data source to the previous one. If you want to do this, you must press the new chart and head to the right-hand side of your window. From there, you can select Data. On the dropdown menu, select Data source and click on Blended Data. You will see “Edit data source” after clicking the blended data.

If done correctly, a new window will open that will enable you to modify and control data metrics for every data source. In addition, you can remove any field you don’t want in the concluding blended data chart.
Step 4 – creating a combined blended data chart
If you are in step 4, it means you have blended your data sources in Google Data Studio. However, that isn’t the end because you can do more with the visualization tool. Assuming you use Google Ads and Facebook as your two data sources, showing the number of clicks you get on your website over a while.
Peradventure, you want to check the click from both platforms, represented in a line graph, you have to blend data using the steps mentioned above. However, you might not only want to blend but unify two different data. In this situation, you can copy the recently generated blended data chart, keep it on the right and change the name to avoid mix-up.
Click on the blended & Unified data chart on the Google Data Studio window. Then go to data and select “Metric.” On the dropdown, you will see Add metric where you can select “Create Field.” A new window will open after you select “Create Field,” allowing you to type the new metric name.
Limitation of data blending in Google Data Studio
Google Data Studio is an essential tool with several advantages. Despite its unique capabilities, it comes with a few limitations. With several data visualization guides available online, it is hard to see the common pitfalls that come with the tool. In this section, we will look at the limitations in Google data studio and how to overcome these constraints.
It uses left outer join
In Google Data Studio, blending data trails SQL parameters for Left Outer Join. It functions by blending data by gathering all the left source records and combining them using matching records from the right data source. Data science professionals use seven different types of table joins.

Practically, it means you need to pay additional attention to blending two data sources and the order you blend these data. When blending, the first data source added will represent the data source used. Therefore, any additional entries won’t be added to the new dataset. It’s a limiting process of joining tables. However, Big Query can serve as an alternative to handle bigger data.
Limitation of blending five data sources sharing a joining key
When it comes to joining tables and blending data sources, a huge limitation of data blending in Google Data Studio is that you can’t blend more than five data sources to create a new data source. Another issue is that it doesn’t handle any missing value. It is hard to blend if the values are in the join keys in this situation. The best option for addressing this limitation is to blend the data offline using Excel or Google Sheets.
Combining multiple data sources might lead to broken reports
Building a data studio report comes with several challenges such as advanced user configuration error, unknown data sources, breaking charts, data set configuration. The list is highly endless. Regrettably, there is no helpful information regarding these data studio errors. When faced with this situation, you can minimize everything you won’t require and combine different dashboards into one.
Connects depends on internal database schema
Working with Google Data Studio, you have several connectors at your disposal to use in your report. Google source contains only one connection for each property. Instead of using each connector, you can integrate it directly with the APIs instead of using the connectors.
Conclusion
Data blending in Google Data Studio provides a reasonable way to analyze data in real-time. With Google Data Studio, you can connect third-party data sources and blend data to compare. Today, many businesses are using data blending to position their team and improve their business.
Overall, data blending allows you to compare a maximum of five data sources using a single graph or table. It uses a common dimension known as a joining key, connecting data from multiple sources. Finally, you have the leverage of blending more than two data sources – Google AdWords and Facebook Ads.
In this article, we have been able to look at how to overcome the limitation of data blending in Google Data Studio. Notwithstanding the limitations, you can conveniently blend data effortlessly. It’s never easy blending data in Google Data Studio, especially if you are a newbie. You can get into a huge problem that would require a professional to handle. Our unique Google Analytics offers two dashboards – Audience overview and acquisition overviews.