Countless people have a Facebook account. Some of them use their FB account to connect to friends and family. Others use it for advertising and business. If you advertise on Facebook, you can take advantage of the massive population. Every month, Facebook attracts more than 2.3 billion users. As an entrepreneur, you have an opportunity to create brand awareness via Facebook ads. With this comes Facebook ads location reporting, an activity that can help fuel your progress.
Facebook ads reporting – what is it?
Running ad campaigns is vital but not sufficient to attain your goals. If you want the ads to attract users, and generate leads, analyze them often. It is an easy task to do because there is a reporting tool within Facebook Ads Manager. It is known as Ads Reporting, and it can let you create reports, study the performance of your ads campaigns, and make changes. Although the reports exist by default, you can modify them with the provided filters and metrics. Facebook ads reporting can let you export, schedule, and share reports to clients by email. Again you can make recurring reports generation and emailing schedules.
The Structure of the Ads Manager dashboard
The Facebook ads location reporting dashboard has columns. Data will start filling these columns once you begin running your ads campaigns. To see and compare the actual performance, use the date selector filter. The default settings in Ads Manager are helpful but not enough for every business. Some of you might have to customize those ad report columns to suit their business goals. You can try out our Facebook ads dashboard templates for custom build reports.
The Ads Manager Table includes various parameters by default. These are Budget, Attribution settings, Results, Reach, Impressions, Cost per result, Amount spent, and Ends. As you will see later on, you should click on the Columns drop-down list to edit these parameters. To edit these columns, click on the Columns drop-down menu. It is in the Ads Manager’s top-right corner.
Where does someone begin?

Before doing Facebook ads location reporting, you should create campaigns in Facebook Ads Manager. To create an ad campaign, choose your objectives first. Do you want to get more likes on your pages, or do you want to drive traffic to your business website? Next, create one ad set or more per campaign. At the same time, choose your parameters. Under every ad set, create as many ads as you like. Make sure to use separate variables per ad.
When you finish, the next thing is to assess the performance of every ad in each campaign. You can use the breakdown tool to analyze ad sets to locate poorly-performing ones. It would be a difficult task without Facebook Ads Manager’s reporting tools. To learn how to do this, continue reading this article.
Important metrics people like to track
The following are the most common metrics for Facebook ads location reporting.
Lead Generation
Virtually everyone using Facebook for advertising wants to generate leads. Thus, tracking and measuring lead generation metrics can let you estimate the degree of interest in your product or service. How many would want to join a contest or a webinar you may be offering? It is essential to track lead generation no matter what you have on Facebook.
E-Commerce
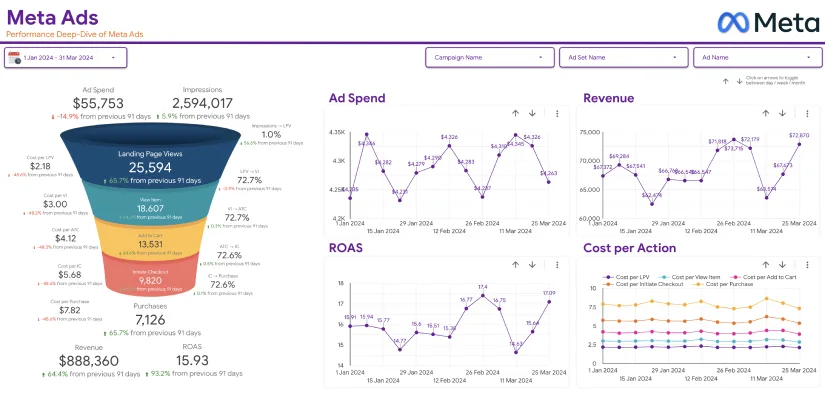
You want to track a user’s path before purchasing your product or service. So customize columns to have a rough idea of their journey through the sales funnels. Where do they stray from the path? To understand this, create columns for various conversion actions. Here you also find Google data studio sales dashboard report crating that will be helpful for your e-commerce sales tracking.
Relevance Score
Every ad campaign on Facebook receives a score of one to ten. The score demonstrates how best your ads fit the audience. A higher score indicates best campaign performance and vice versa. To keep your campaigns running, track the relevance score metric. Otherwise, Facebook might remove campaigns with low relevance scores.
Frequency
It is vital to know how often your target users have seen your ads. Is your ad beginning to lose relevance until people are sick of viewing it? The frequency metric can help you identify ads fatigue and take measures to control it before it ruins your relevance score.
How to do Facebook ads location reporting
To create a report using Facebook Ads Reporting is easy. The steps include:
Step one – Open Facebook Ads Manager dashboard. Next, choose Customize Columns to alter the ones that exist by default.
Step two – You should already know the sections to add to your report. Then, edit unneeded columns in the Customize Columns window. Simultaneously, add the sections that you need in your report. The window shows Engagement, Conversions, Optimization, A/B Test, and Settings.
Step Three – Name your newly-added columns. After that, click on Save as Preset at the lower-left corner of the Customize Columns window. Click Apply to store your changes. You could also save the report as default.
Customizing options
Facebook ads location reporting entails customization of the reports you have created. There are things you can add, edit, or remove. These include:
Breakdowns
You can choose breakdowns by ad set name or by campaign name. These breakdowns include:
Time -The Time category shows more information by Day, Week, Two Weeks, and Month.
Level – It entails things like Ad set, Ad, and Campaign.
Demographics – Demographics include age, gender, region, country, business locations, and DMA (designated market area) region. The altered reports will show geographic data like the location of those who view your ads. You break down this data with DMA, for instance, to see the exact location of ad views.
Delivery – It is about Placement and Device, Placement, Platform, Platform and Device, and Time of Day by Viewer’s Time Zone. You can see to whom the ads were delivered and by what media by clicking on Media Type.
Actions – It includes a range of things. Some of these include video View Type, Conversion Device, Canvas Component, and Video Sound among others.
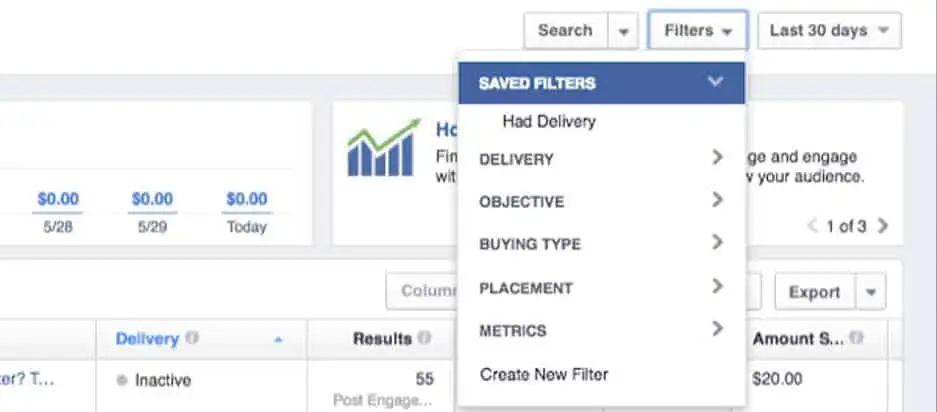
Add Ads Filters
To customize the appearance of your results in Facebook Ads Manager, choose Filters. Once the drop-down menu appears, select the filters you want. Alternatively, you can make your filter using Create New Filter function. The easy steps include:
- Add a keyword that you wish to filter by to the Filters.
- Click on Apply to save the change.
- Select the (+) icon and add extra filters.
- To edit or remove a filter, click on the X icon.
- Click on Clear to remove all your filters.
Customize columns
To do this, click on Columns/Performance. After that, select Customize Columns option. Other items appear under Performance, including Delivery, Engagement, Video Engagement, Cross-Device, and more. You can customize the columns based on budget, reach, results, costs, frequency, impressions, and others things. You will see them when you click each column.
Attribution window
The default window is usually a 28-day click and a 1-day view. Checking the attribution window is necessary because you can identify when people respond after viewing your ads. You can, therefore, attribute a certain number of conversions to a given time interval. In short, the Attribution window can let you measure the visual effect of your ads.
How to Export your Facebook Ads Report
Before sharing the report you have created and customized, export it. The technique is easy:
- Move to Ads Manager
- Click on the Export button
- Choose the file format you want
- Click Export.
How to schedule your Facebook ads reports
So far, you have learned how to create, save, customize, and export your reports. Next in Facebook ads location reporting, we will show you how to schedule your ads. You can have reports sent to your email or other emails based on a preset interval. Again, it is as easy as this:
- Assuming you have your report ready and have saved it, choose Schedule Email
- Choose how often you want to send reports
- Save.
How to Edit Reports in Ads Reporting
Access Ads Reporting and do the following things.
- There is a Right-hand column named Breakdowns. Click it to add or adjust breakdowns. To activate sorting of fields, you can group or ungroup breakdowns. Choose a sorting symbol close to any cell you intend to sort and the Group. Repeat the same to Ungroup.
- Next, Click the Metrics tab to add metrics to your report.
- Click on Filters to add filters above the table.
- Select column header to sort data with columns.
- You can compare attribution windows by clicking a right-hand side button labeled More. Once you click the windows to contrast, click on Apply.

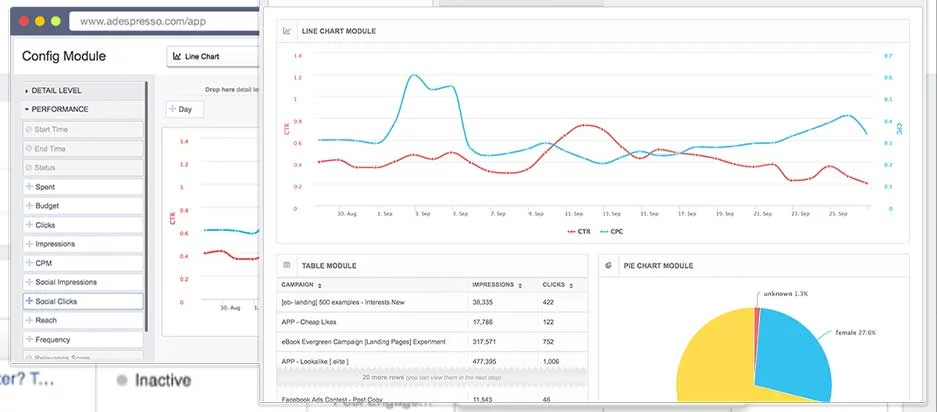
We have been discussing the first method called Ads Reporting. It is within Facebook Ads Manager. It can let you make trend charts, bar charts, and pivot tables. Luckily, Ads Reporting is not the only technique you have. There is also Google Data Studio or GDS. GDS is a data reporting and visualization tool, just in case you do not know it.
It is a free tool that can create interactive tables and charts using many data sources. GDS can let you make reports that update automatically. Additionally, you can customize and style your reports to make them more attractive. To analyze Facebook ad results in GDS, you need Google Analytics. Install it on your website, and it will do the rest.
So, how can you build GDS reports?
You can make them from scratch or use a readily-designed template. Designing a new GDS report from zero is a long process that we will not discuss today. Instead, we will recommend using a sample GDS template. The best thing about it is that your work will be simple. You can avoid the long Facebook ads location reporting process by following easy steps.
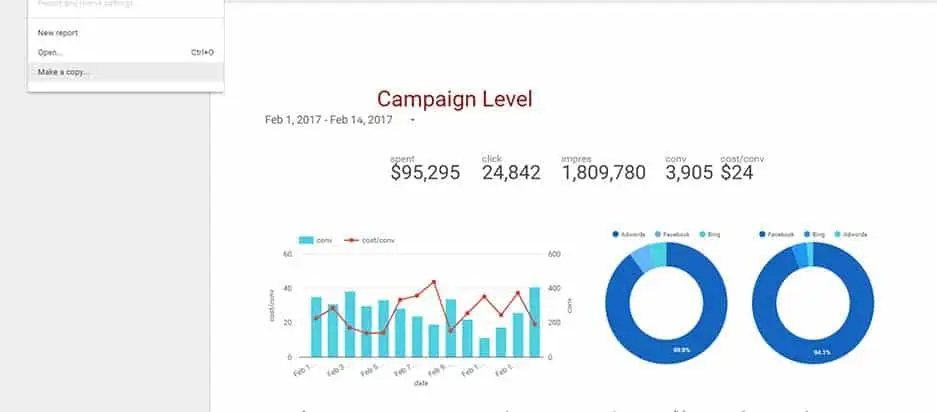
There is a premade GDS report that you can copy and customize. To copy the report, first, click on the template. Then, choose to make a copy. As the data in the sample does not relate to your business, you have to alter it. So, choose a new data source like your Google Analytics or your client’s Google Analytics. Click Create Report to enable GDS to replace template data with your data or your client’s data.
A template will also give you an option to swap logos so that the GDS report can be yours. From there on, you can customize your new report. Providers of Google Data Studio for Facebook ads location reporting are many. However, you should select the one offered at eaglytics-co.com. It is so easy to understand and use. It will be reliable each time you are tracking your Facebook ads performance.
Conclusion
So far, you know how to do Facebook ads location reporting. You can create, edit, customize, schedule, and share your reports using Ads Reporting. We have also revealed a different method, Google Data Studio reporting. It is possible to make a report from scratch. However, the quickest approach is to use a sample GDS template. Now you can design new advertising campaigns and test them to see their actual performances. After that, you will determine if you can increase or decrease your Facebook advertising budget.